Nov 7, 2026
Geographic Doesn't Mean Cartographic
📊 Source deck: Chatbots as an Interface for Spatial Data and Analysis · June 2017 · Esri R&D DC
Video: DevSummit 2017 plenary demo · Demo Theater with architecture · Code: github.com/esri/sonar
🎙️ Voice pass 2026-11-07: rewritten to docs/voice/style-guide.md from the earlier draft (prior version is in page history). To fill in: nothing.
- Venue [verify]. The deck says Esri R&D DC, June 2017. A GeoNYC Meetup listing uses this exact title, so the draft names GeoNYC. Confirm or change.
- Opening scene. The trash-day line is from your 2024 post “Announcing AI Assistants for ArcGIS,” which now also supplies the FedGIS 2024 Hub AI Assistant demo (with Adam Pfister) in the last section.
- “Eight years on” section [verify]. The newest material and the least grounded in the deck; check it against your current view.
- Images are hosted from the presentations site. The stick chart and street photos were in the deck without credits. Find sources before publishing.
When I moved into DC, my first question was “when is trash day?” The answer existed. The city published it as a dataset, attached to a polygon, on a map you could find if you knew which agency’s website to look on. I’d spent years helping build maps like that, so I knew where to look, but nobody should need that background to find out when to put the bins out.
In June 2017 I gave a talk at GeoNYC [verify] with a title that was a bit of a provocation for a room full of geographers: “Chatbots as an Interface for Spatial Data and Analysis.” The argument underneath was simpler. A map is one interface to geography, and for a lot of everyday questions it isn’t the best one.
I started with maps, because I love them. A landscape painting visualizes structure, and a 3D-printed terrain model lets you put your hand on a watershed. Then came a slide I’ve reused many times since, a Marshall Islands stick chart: bent sticks lashed together, with shells marking islands, encoding how ocean swells bend around land. Navigators studied them and left them on shore. It’s a deeply spatial artifact and nothing about it looks like what we’d call a map, which is where the title of this post comes from.
 A Marshall Islands stick chart, from the original deck
Geographic doesn’t mean cartographic, and that matters once you think about who geographic systems serve. The systems my colleagues and customers build manage public, physical infrastructure: roads, pipes, parcels, trash routes and crime reports. That infrastructure supports a community, and the community is people with very different perspectives, devices, abilities and patience for government websites.
The phrase I kept coming back to in those years was data-driven citizenship. If governments publish data as public digital infrastructure, it has to be accessible, and accessible means meeting people where they are. In 2017 that was Slack, Facebook Messenger and, increasingly, a cylinder on the kitchen counter that you talked to. So the question I wanted to answer was the one behind our open-source MyStreet app: “What’s going on around me?”
 “What’s going on around me?” The MyStreet slide
Talk to your infrastructure
Sonar was our experiment at the Esri R&D Center in DC. You could ask it in plain language about trash and recycling pickup, recent crime or the demographics of your address, and it answered in Slack, through a Facebook page or as an Alexa skill. We showed it in the DevSummit 2017 plenary in Palm Springs, and then Dave Bouwman and I walked through the internals in a Demo Theater session we called “GeoBots.”
The architecture was deliberately boring. Chat, social and voice inputs hit Amazon API Gateway, which called Node.js Lambda functions we deployed with Claudia.js, and those called ArcGIS geocoding, routing and GeoEnrichment along with city open data and hosted feature services. There were no servers to babysit.
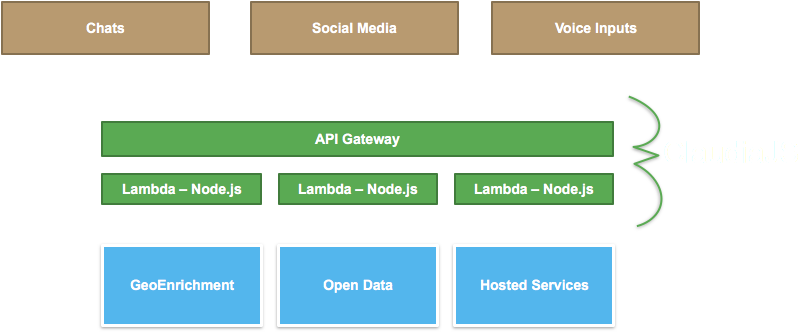 Sonar architecture: chat, social, and voice inputs through API Gateway and Lambda to GeoEnrichment, open data, and hosted services
The part I’m still proudest of was treating ordinary web maps as a voice interface. Every ArcGIS web map already has popup templates, written by a GIS analyst to describe a feature: “Trash pickup is {FREQ_REFUSE} and Recycling is {FREQ_RECYCLING}.” Swap the popup panel for a speaker and years of careful cartographic configuration become conversational answers, without anyone authoring anything new.
Design for humans
Building Sonar also taught us what the map had been quietly hiding. Data gets written for databases, so the city’s pickup schedule said “Mon,” “Tue,” “Thu” and sometimes “Thurs.” On a map nobody notices, but read aloud by Alexa it comes out as gibberish, and a surprising share of the real work was translating codes and abbreviations into words a person would actually say.
Conversation also trades discoverability for predictability. A map shows you everything at once and lets your eye wander, while a conversation only answers the question you thought to ask. We had to choose between a scripted bot, predictable but narrow, and an AI-driven one that was flexible but could surprise you, and not always pleasantly. In 2017 we chose scripted. Privacy and accessibility had to be inputs from the start too, since “what’s around me” requires knowing where “me” is, and voice is a real accessibility win for some people and a new barrier for others.
One line from my speaker notes is what I’d keep if I had to throw out the rest of the talk: the only good reason to add voice as an input method, or audio as an output, is because it makes the product better for the user. Novelty doesn’t count, and neither does a fun demo (it was a fun demo).
Eight years on
The last slide of the deck said, simply, experiment. Sonar never became a product, and the code is still sitting on GitHub, but the bet underneath it aged better than the implementation. In 2017 the AI option on our considerations slide was the risky one, the thing you avoided if you wanted reliable answers. Large language models flipped that almost completely.
In February 2024, at FedGIS, Adam Pfister and I showed the Hub AI Assistant we’d been building in close collaboration with the city of Washington, DC. It was connected to DC’s open data site, and the first question in the demo was the one I’d asked when I moved into the city. This time it found the trash days for 800 East Capitol St NE and linked back to the source data, with a map and the geocoded location, so people could check the answer for themselves.
So the conversation layer had become the easy part. What’s hard is exactly what was hard in 2017: authoritative data, fields described in plain language, and knowing which trash schedule applies to which house. The popup templates and well-described attributes that made Sonar work are now what make a civic dataset legible to an AI assistant. [verify: Andy’s current view] If you publish civic data, the most useful thing you can do for the next interface is the same thing that helped the last one: write the popup as if someone will hear it read aloud.