<?xml version="1.0" encoding="utf-8"?><feed xmlns="http://www.w3.org/2005/Atom" xml:lang="en-US"><generator uri="https://jekyllrb.com/" version="4.4.1">Jekyll</generator><link href="https://highearthorbit.com/feed.xml" rel="self" type="application/atom+xml" /><link href="https://highearthorbit.com/" rel="alternate" type="text/html" hreflang="en-US" /><updated>2026-11-20T11:23:09-05:00</updated><id>https://highearthorbit.com/feed.xml</id><title type="html">High Earth Orbit</title><subtitle>Andrew Turner, CTO of ArcGIS Hub, on open data, civic technology, the geospatial web, and the systems that connect them.</subtitle><author><name>Andrew Turner</name></author><entry><title type="html">Geographic Doesn’t Mean Cartographic</title><link href="https://highearthorbit.com/articles/geographic-doesn-t-mean-cartographic/" rel="alternate" type="text/html" title="Geographic Doesn’t Mean Cartographic" /><published>2026-11-07T00:00:00-05:00</published><updated>2026-11-07T00:00:00-05:00</updated><id>https://highearthorbit.com/articles/geographic-doesn-t-mean-cartographic</id><content type="html" xml:base="https://highearthorbit.com/articles/geographic-doesn-t-mean-cartographic/"><![CDATA[<blockquote>
  <p>📊 <strong>Source deck:</strong> <a href="https://ajturner.github.io/presentations/sonar/">Chatbots as an Interface for Spatial Data and Analysis</a> · June 2017 · Esri R&amp;D DC</p>

  <p><strong>Video:</strong> <a href="https://youtu.be/H_cdn2kVB-E?t=4m35s">DevSummit 2017 plenary demo</a> · <a href="https://youtu.be/1J5y8sJ9aKI">Demo Theater with architecture</a> · <strong>Code:</strong> <a href="https://github.com/esri/sonar">github.com/esri/sonar</a></p>
</blockquote>

<blockquote>
  <p>🎙️ Voice pass 2026-11-07: rewritten to docs/voice/<a href="http://style-guide.md/">style-guide.md</a> from the earlier draft (prior version is in page history). To fill in: nothing.</p>

  <ul>
    <li><strong>Venue [verify].</strong> The deck says Esri R&amp;D DC, June 2017. A <a href="https://www.meetup.com/geonyc/events/240555333">GeoNYC Meetup listing</a> uses this exact title, so the draft names GeoNYC. Confirm or change.</li>
    <li><strong>Opening scene.</strong> The trash-day line is from your 2024 post “Announcing AI Assistants for ArcGIS,” which now also supplies the FedGIS 2024 Hub AI Assistant demo (with Adam Pfister) in the last section.</li>
    <li><strong>“Eight years on” section [verify].</strong> The newest material and the least grounded in the deck; check it against your current view.</li>
    <li><strong>Images</strong> are hosted from the presentations site. The stick chart and street photos were in the deck without credits. Find sources before publishing.</li>
  </ul>
</blockquote>

<p>When I moved into DC, my first question was “when is trash day?” The answer existed. The city published it as a dataset, attached to a polygon, on a map you could find if you knew which agency’s website to look on. I’d spent years helping build maps like that, so I knew where to look, but nobody should need that background to find out when to put the bins out.</p>

<p>In June 2017 I gave a talk at GeoNYC [verify] with a title that was a bit of a provocation for a room full of geographers: “Chatbots as an Interface for Spatial Data and Analysis.” The argument underneath was simpler. A map is one interface to geography, and for a lot of everyday questions it isn’t the best one.</p>

<p>I started with maps, because I love them. A landscape painting visualizes structure, and a 3D-printed terrain model lets you put your hand on a watershed. Then came a slide I’ve reused many times since, a Marshall Islands stick chart: bent sticks lashed together, with shells marking islands, encoding how ocean swells bend around land. Navigators studied them and left them on shore. It’s a deeply spatial artifact and nothing about it looks like what we’d call a map, which is where the title of this post comes from.</p>

<p><img src="https://ajturner.github.io/presentations/sonar/img/stick-chart.jpg" alt="A Marshall Islands stick chart, from the original deck" />
<em>A Marshall Islands stick chart, from the original deck</em></p>

<p>Geographic doesn’t mean cartographic, and that matters once you think about who geographic systems serve. The systems my colleagues and customers build manage public, physical infrastructure: roads, pipes, parcels, trash routes and crime reports. That infrastructure supports a community, and the community is people with very different perspectives, devices, abilities and patience for government websites.</p>

<p>The phrase I kept coming back to in those years was <em>data-driven citizenship</em>. If governments publish data as public digital infrastructure, it has to be accessible, and accessible means meeting people where they are. In 2017 that was Slack, Facebook Messenger and, increasingly, a cylinder on the kitchen counter that you talked to. So the question I wanted to answer was the one behind our open-source <a href="https://github.com/esri/mystreet">MyStreet</a> app: “What’s going on around me?”</p>

<p><img src="https://ajturner.github.io/presentations/sonar/img/street.jpg" alt="&quot;What's going on around me?&quot; The MyStreet slide" />
<em>“What’s going on around me?” The MyStreet slide</em></p>

<h3 id="talk-to-your-infrastructure">Talk to your infrastructure</h3>

<p><a href="https://github.com/esri/sonar">Sonar</a> was our experiment at the Esri R&amp;D Center in DC. You could ask it in plain language about trash and recycling pickup, recent crime or the demographics of your address, and it answered in Slack, through a Facebook page or as an Alexa skill. We showed it in the <a href="https://youtu.be/H_cdn2kVB-E?t=4m35s">DevSummit 2017 plenary</a> in Palm Springs, and then Dave Bouwman and I walked through the internals in a <a href="https://youtu.be/1J5y8sJ9aKI">Demo Theater session</a> we called “GeoBots.”</p>

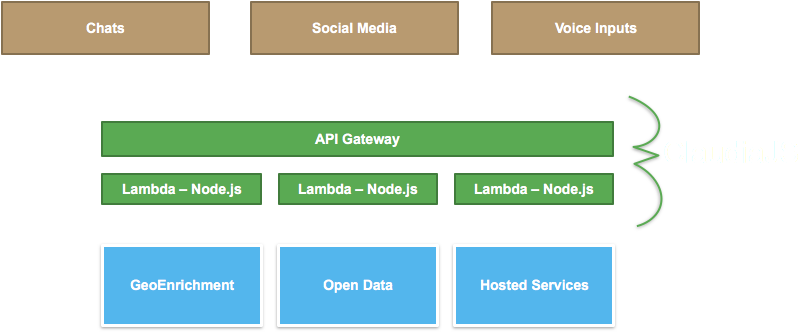
<p>The architecture was deliberately boring. Chat, social and voice inputs hit Amazon API Gateway, which called Node.js Lambda functions we deployed with Claudia.js, and those called ArcGIS geocoding, routing and GeoEnrichment along with city open data and hosted feature services. There were no servers to babysit.</p>

<p><img src="https://ajturner.github.io/presentations/sonar/img/sonar-architecture.png" alt="Sonar architecture: chat, social, and voice inputs through API Gateway and Lambda to GeoEnrichment, open data, and hosted services" />
<em>Sonar architecture: chat, social, and voice inputs through API Gateway and Lambda to GeoEnrichment, open data, and hosted services</em></p>

<p>The part I’m still proudest of was treating ordinary web maps as a voice interface. Every ArcGIS web map already has popup templates, written by a GIS analyst to describe a feature: “Trash pickup is {FREQ_REFUSE} and Recycling is {FREQ_RECYCLING}.” Swap the popup panel for a speaker and years of careful cartographic configuration become conversational answers, without anyone authoring anything new.</p>

<h3 id="design-for-humans">Design for humans</h3>

<p>Building Sonar also taught us what the map had been quietly hiding. Data gets written for databases, so the city’s pickup schedule said “Mon,” “Tue,” “Thu” and sometimes “Thurs.” On a map nobody notices, but read aloud by Alexa it comes out as gibberish, and a surprising share of the real work was translating codes and abbreviations into words a person would actually say.</p>

<p>Conversation also trades discoverability for predictability. A map shows you everything at once and lets your eye wander, while a conversation only answers the question you thought to ask. We had to choose between a scripted bot, predictable but narrow, and an AI-driven one that was flexible but could surprise you, and not always pleasantly. In 2017 we chose scripted. Privacy and accessibility had to be inputs from the start too, since “what’s around me” requires knowing where “me” is, and voice is a real accessibility win for some people and a new barrier for others.</p>

<p>One line from my speaker notes is what I’d keep if I had to throw out the rest of the talk: the only good reason to add voice as an input method, or audio as an output, is because it makes the product better for the user. Novelty doesn’t count, and neither does a fun demo (it was a fun demo).</p>

<h3 id="eight-years-on">Eight years on</h3>

<p>The last slide of the deck said, simply, <em>experiment</em>. Sonar never became a product, and the code is still sitting on GitHub, but the bet underneath it aged better than the implementation. In 2017 the AI option on our considerations slide was the risky one, the thing you avoided if you wanted reliable answers. Large language models flipped that almost completely.</p>

<p>In February 2024, at FedGIS, Adam Pfister and I showed the <a href="https://highearthorbit.com/articles/announcing-ai-assistants-for-arcgis/">Hub AI Assistant</a> we’d been building in close collaboration with the city of Washington, DC. It was connected to DC’s open data site, and the first question in the demo was the one I’d asked when I moved into the city. This time it found the trash days for 800 East Capitol St NE and linked back to the source data, with a map and the geocoded location, so people could check the answer for themselves.</p>

<p>So the conversation layer had become the easy part. What’s hard is exactly what was hard in 2017: authoritative data, fields described in plain language, and knowing which trash schedule applies to which house. The popup templates and well-described attributes that made Sonar work are now what make a civic dataset legible to an AI assistant. [verify: Andy’s current view] If you publish civic data, the most useful thing you can do for the next interface is the same thing that helped the last one: write the popup as if someone will hear it read aloud.</p>]]></content><author><name>Andrew Turner</name></author><category term="Technology" /><category term="Government" /><summary type="html"><![CDATA[📊 Source deck: Chatbots as an Interface for Spatial Data and Analysis · June 2017 · Esri R&amp;D DC Video: DevSummit 2017 plenary demo · Demo Theater with architecture · Code: github.com/esri/sonar]]></summary></entry><entry><title type="html">You Don’t Have to Be in a Crisis</title><link href="https://highearthorbit.com/articles/you-dont-have-to-be-in-a-crisis/" rel="alternate" type="text/html" title="You Don’t Have to Be in a Crisis" /><published>2026-11-07T00:00:00-05:00</published><updated>2026-11-07T00:00:00-05:00</updated><id>https://highearthorbit.com/articles/you-dont-have-to-be-in-a-crisis</id><content type="html" xml:base="https://highearthorbit.com/articles/you-dont-have-to-be-in-a-crisis/"><![CDATA[<p>In February 2012, Government Technology named Heather Blanchard, Noel Dickover and me to its <a href="https://www.govtech.com/top-25/CrisisCommons-Co-Founders.html">Top 25 Doers, Dreamers and Drivers</a> for starting CrisisCommons. I hadn’t reread Miriam Jones’s profile in years. It’s six short paragraphs, and it gets the arc right, but of course it can’t hold what those three years were actually like (or how much of what I’ve worked on since started there).</p>

<p>GovTech has us meeting at Transparency Camp in 2009. My own post from that May says a group of us finally pulled the idea together at <a href="/articles/crisiscamp-sign-up-sponsor/">Government 2.0 Camp</a> [TK: which camp it was, or both]. Either way, the question was the same one. People who build software and maps want to help when a disaster hits, but there was no obvious place for them to show up, and no one on the response side asking for them. So on June 13 and 14, 2009, about 200 first responders, technologists, government staff and curious citizens spent a weekend at George Washington University talking through what volunteer technologists could do without getting in the way. At the last CrisisCampDC meeting that summer, on a whim I registered crisiscommons.org, installed MediaWiki, and <a href="/articles/crisiscommons-and-congress/">Mikel Maron provided a logo</a>.</p>

<p>For the next nine months it was side projects and good conversations without much of a center. Then on January 12, 2010, the earthquake struck Haiti. By that Thursday we had decided to host a CrisisCampHaiti in DC, and four other cities quickly did the same. Five days after the quake, <a href="/articles/grassroots-crisis-development-organization/">more than 400 people in five cities</a> were working on 13 projects. The following week there were fourteen more camps, and within fifteen weeks there were 65 camps in ten countries.</p>

<p>The work was concrete. Volunteers built Tradui so responders could translate between Kreyol and English. Thousands traced roads and buildings into OpenStreetMap from 1990s paper maps and then fresh satellite imagery, until Port-au-Prince had a usable damage map where good maps had barely existed. At FortiusOne we loaded maps and data onto USB drives and <a href="/articles/updates-from-haiti/">sent them down</a> for teams working with little or no connectivity. What struck me then, and still does, is that technology multiplies a contribution. Instead of sending $5 by text message, people gave their time and skill, and a dataset or a piece of code shared openly fed every other project that needed it.</p>

<p>The hardest part was never the code. Traditional responders were rightly wary of a crowd of enthusiastic volunteers arriving with untested tools, and they said so. The real job became translation in both directions: helping response organizations say what they needed, and helping volunteers build that instead of whatever was fun to build. That is what GovTech meant by CrisisCommons becoming “a liaison between response organizations and technical volunteers.” With a grant from the <a href="/articles/crisiscommons-receives-funding-from-sloan-foundation/">Sloan Foundation</a> through the Wilson Center, we spent the next two years trying to make that bridge last.</p>

<p>In January 2012, Heather and Noel stepped down so the organization could grow beyond its founders, which takes its own kind of leadership. I stayed on while serving as CTO of FortiusOne. Ten months later, during Hurricane Sandy, I spent a Saturday in FEMA’s National Response Coordination Center with people from FEMA, the White House and the Red Cross, working out where people in New Jersey and New York could still find gas. Meanwhile <a href="/articles/crisiscamp-sandy/">CrisisCamps in more than ten cities</a> worked remotely on gas stations, damage reports and getting kids back to school. Three years earlier, traditional responders had worried aloud that volunteers would only add confusion. That weekend, as Di-Ann Eisnor put it, “it was a given that a solution be crowdsourced.”</p>

<p>Noel had the best line in the GovTech piece: CrisisCommons gave people “the idea that you don’t have to be in a crisis to make a difference.” I’ve thought about that a lot since. A disaster shows you, all at once, whether a community’s information is open, current and usable by whoever needs it, and most days those gaps go unnoticed. So the best preparation turned out to be everyday infrastructure: governments publishing authoritative data openly, and neighbors who already know how to use it. That is the work behind ArcGIS Hub, and why I still think of open data as public infrastructure, as basic as roads.</p>

<p>[TK: a person or moment from those years that stays with you, and what you’d tell someone starting a volunteer tech effort today.]</p>

<p>Thank you to Heather, Noel, Mikel, and the thousands of volunteers who showed up, in person and online, when it mattered. If you were one of them, I’d love to hear what you’ve been building since.</p>]]></content><author><name>Andrew Turner</name></author><category term="CrisisCommons" /><category term="CrisisCommons" /><category term="crisis" /><category term="open data" /><category term="civic" /><summary type="html"><![CDATA[In February 2012, Government Technology named Heather Blanchard, Noel Dickover and me to its Top 25 Doers, Dreamers and Drivers for starting CrisisCommons. I hadn’t reread Miriam Jones’s profile in years. It’s six short paragraphs, and it gets the arc right, but of course it can’t hold what those three years were actually like (or how much of what I’ve worked on since started there).]]></summary></entry><entry><title type="html">Announcing AI Assistants for ArcGIS</title><link href="https://highearthorbit.com/articles/announcing-ai-assistants-for-arcgis/" rel="alternate" type="text/html" title="Announcing AI Assistants for ArcGIS" /><published>2024-02-19T13:47:00-05:00</published><updated>2024-02-19T13:47:00-05:00</updated><id>https://highearthorbit.com/articles/announcing-ai-assistants-for-arcgis</id><content type="html" xml:base="https://highearthorbit.com/articles/announcing-ai-assistants-for-arcgis/"><![CDATA[<p class="wp-block-paragraph">Last week, I shared our work at Esri adding generative AI to ArcGIS. Over the past year, I&#8217;ve been leading a new ArcGIS Hub AI Assistant in close collaboration with the city of Washington, DC to support easy access and understanding of <a href="https://opendata.dc.gov/" target="_blank" rel="noopener" title="">open data about the city.</a> This work builds from <a href="https://highearthorbit.com/articles/geoai-and-the-future-of-mapping/" title="">my talk at the National Academies</a> on the future of GeoAI and the potential for improved access to information. </p>


<p class="wp-block-paragraph">The future is exciting, and these AI assistants will be progressively released throughout 2024. They are just a few examples of the many generative AI related projects across Esri. </p>


<iframe loading="lazy" id="kmsembed-1_opret32t" width="608" height="402" src="https://mediaspace.esri.com/embed/secure/iframe/entryId/1_opret32t/uiConfId/49806163/pbc/334881262/st/0" class="kmsembed" allowfullscreen webkitallowfullscreen mozAllowFullScreen allow="autoplay *; fullscreen *; encrypted-media *" referrerPolicy="no-referrer-when-downgrade" sandbox="allow-downloads allow-forms allow-same-origin allow-scripts allow-top-navigation allow-pointer-lock allow-popups allow-modals allow-orientation-lock allow-popups-to-escape-sandbox allow-presentation allow-top-navigation-by-user-activation" frameborder="0" title="ArcGIS and Generative AI Assistants"></iframe>


<p class="wp-block-paragraph">My colleague, Adam Pfister, and I presented at the Esri FedGIS 2024 conference. You can watch the <a href="https://mediaspace.esri.com/media/t/1_opret32t" target="_blank" rel="noopener" title="">video recording here</a> or read the transcript below which may be easier to read and understand what we&#8217;re doing.</p>


<h2 class="wp-block-heading">ArcGIS and Generative AI Assistants</h2>


<p class="wp-block-paragraph">Over the past several years, Esri has been adding machine learning and <a href="https://www.esri.com/en-us/capabilities/geoai/overview" title="">GeoAI</a> to ArcGIS to provide you with advanced spatial analysis capabilities.</p>


<p class="wp-block-paragraph">Last year, there was a revolutionary shift with the development of Large Language Models, or LLMs, used in Generative AI. These advancements have opened new avenues for interactive, accessible experiences. You might have heard of <a href="https://copilot.microsoft.com/" title="">Microsoft’s CoPilot</a> and <a href="https://openai.com/" title="">OpenAI’s ChatGPT</a>. These capabilities change how people work by providing creative reasoning and natural language interfaces.</p>


<p class="wp-block-paragraph">Across Esri, we’ve been exploring new capabilities that use generative AI to automate and accelerate workflows.</p>


<p class="wp-block-paragraph">It starts by following the WebGIS pattern. Publish your data as services, including high-quality metadata. Use these data services as layers in a map, and use in Applications.</p>


<div class="wp-block-image">
<figure class="aligncenter size-large is-resized"><img data-recalc-dims="1" loading="lazy" decoding="async" width="840" height="625" src="https://i0.wp.com/highearthorbit.com/wp-content/uploads/2024/02/image.png?resize=840%2C625&#038;ssl=1" alt="" class="wp-image-381" style="width:442px;height:auto" srcset="https://i0.wp.com/highearthorbit.com/wp-content/uploads/2024/02/image.png?resize=1024%2C762&amp;ssl=1 1024w, https://i0.wp.com/highearthorbit.com/wp-content/uploads/2024/02/image.png?resize=300%2C223&amp;ssl=1 300w, https://i0.wp.com/highearthorbit.com/wp-content/uploads/2024/02/image.png?resize=768%2C572&amp;ssl=1 768w, https://i0.wp.com/highearthorbit.com/wp-content/uploads/2024/02/image.png?w=1376&amp;ssl=1 1376w" sizes="auto, (max-width: 840px) 100vw, 840px" /></figure>
</div>


<p class="wp-block-paragraph">We are developing new “AI Assistants” that extend these Apps which use Agents with specialized training, prompt engineering, and LLM to provide particular skills. These use our Tools to access the live data and services – which is important to ensure that answers are accurate and trustworthy.</p>


<p class="wp-block-paragraph">We envision generative AI being available across ArcGIS. I’m going to show you a few examples of our research developing AI Assistants into ArcGIS Hub, Survey123, and integrates ArcGIS System.</p>


<h2 class="wp-block-heading">Open Data DC</h2>


<p class="wp-block-paragraph">The city of Washington, DC uses <a href="https://opendata.dc.gov/" title="">hub to share their data, documents, and apps through a focused catalog</a> that supports constituents, partners, and developers to use in their own decision making. The data can be explored, downloaded, access via APIs, and integrated into configurable apps.</p>


<figure class="wp-block-image size-large"><img data-recalc-dims="1" loading="lazy" decoding="async" width="840" height="1000" src="https://i0.wp.com/highearthorbit.com/wp-content/uploads/2024/02/image-1.png?resize=840%2C1000&#038;ssl=1" alt="" class="wp-image-382" srcset="https://i0.wp.com/highearthorbit.com/wp-content/uploads/2024/02/image-1.png?resize=860%2C1024&amp;ssl=1 860w, https://i0.wp.com/highearthorbit.com/wp-content/uploads/2024/02/image-1.png?resize=252%2C300&amp;ssl=1 252w, https://i0.wp.com/highearthorbit.com/wp-content/uploads/2024/02/image-1.png?resize=768%2C915&amp;ssl=1 768w, https://i0.wp.com/highearthorbit.com/wp-content/uploads/2024/02/image-1.png?resize=1290%2C1536&amp;ssl=1 1290w, https://i0.wp.com/highearthorbit.com/wp-content/uploads/2024/02/image-1.png?w=1604&amp;ssl=1 1604w" sizes="auto, (max-width: 840px) 100vw, 840px" /></figure>


<p class="wp-block-paragraph">Our research indicated that generative AI could help people more quickly &amp; easily get answers to common questions. We are developing a new Hub AI Assistant that will be integrated into ArcGIS Hub and configurable for your organizations’ sites.</p>


<p class="wp-block-paragraph">We connected the Hub AI Assistant to DC’s Open Data site so that all responses are using their authoritative, up-to-date data and information. When I moved into the city, my first question was “<strong>when is trash day</strong>”</p>


<p class="wp-block-paragraph">Now, people can ask this common question to discover relevant information to explore. They can then find the days specific to their address – let’s see at “<strong>check at 800 east capitol st ne</strong>”</p>


<p class="wp-block-paragraph">With generative AI it’s important to ensure the source data are accurate, so the AI Assistant provides links to the data source as well as a map and the geocoded location so the person can verify the information is correct.</p>


<p class="wp-block-paragraph">You can also ask broader questions like “<strong>How many trees are in the city?</strong>” The DC Urban Forestry team publishes datasets with each tree, species, size, and health. You can then ask it to create a map of trees nearby our location. And because the AI Assistant is using the live services – when the forestry team plants a new tree, the next time someone asks the question they will see the newest trees.</p>


<figure class="wp-block-image size-large"><img data-recalc-dims="1" loading="lazy" decoding="async" width="840" height="684" src="https://i0.wp.com/highearthorbit.com/wp-content/uploads/2024/02/image-2.png?resize=840%2C684&#038;ssl=1" alt="" class="wp-image-383" srcset="https://i0.wp.com/highearthorbit.com/wp-content/uploads/2024/02/image-2.png?resize=1024%2C834&amp;ssl=1 1024w, https://i0.wp.com/highearthorbit.com/wp-content/uploads/2024/02/image-2.png?resize=300%2C244&amp;ssl=1 300w, https://i0.wp.com/highearthorbit.com/wp-content/uploads/2024/02/image-2.png?resize=768%2C626&amp;ssl=1 768w, https://i0.wp.com/highearthorbit.com/wp-content/uploads/2024/02/image-2.png?resize=1536%2C1252&amp;ssl=1 1536w, https://i0.wp.com/highearthorbit.com/wp-content/uploads/2024/02/image-2.png?resize=2048%2C1669&amp;ssl=1 2048w, https://i0.wp.com/highearthorbit.com/wp-content/uploads/2024/02/image-2.png?w=1680&amp;ssl=1 1680w, https://i0.wp.com/highearthorbit.com/wp-content/uploads/2024/02/image-2.png?w=2520&amp;ssl=1 2520w" sizes="auto, (max-width: 840px) 100vw, 840px" /><figcaption class="wp-element-caption">The Hub AI Assistant can query data and summarize documents and policies.</figcaption></figure>


<p class="wp-block-paragraph">The Hub AI Assistant answers general questions using the documents, and apps in the city’s Hub. I’m wondering “<strong>who can help me plant a tree</strong>”. There is a simple response and link to the hub page with more information. This helps people understand policies and procedures alongside data exploration.</p>


<p class="wp-block-paragraph">This is an exciting future and you’ve probably already done the hard work by publishing your data as services and adding terrific metadata that the AI Assistants will include in their reasoning. It’s important to realize that the use of your data in generative AI is happening already and accelerating. We are mitigating the risks by limiting inputs to your curated data and configurable guardrails. There is a lot of work to do here, and we’re being careful about how to respond to conversations outside the scope of the assistant.</p>


<p class="wp-block-paragraph">For example, someone may say “<strong>my house is on fire</strong>”. The AI Assistant limits its reasoning and information to the curated data and clearly states when a question is outside of its scope. In this case &#8211; call emergency services using 911.</p>


<p class="wp-block-paragraph">The AI Assistant also helps ensure everyone has easy access to the data using their native language. Parents want to know where their child should attend school, “<strong>¿Cuáles son las escuelas cerca del círculo DuPont?</strong>” The AI Assistant translates questions to query the data and find the best answer. Then it responds in the language the person asked.</p>


<figure class="wp-block-image size-large"><img data-recalc-dims="1" loading="lazy" decoding="async" width="840" height="684" src="https://i0.wp.com/highearthorbit.com/wp-content/uploads/2024/02/image-3.png?resize=840%2C684&#038;ssl=1" alt="" class="wp-image-384" srcset="https://i0.wp.com/highearthorbit.com/wp-content/uploads/2024/02/image-3.png?resize=1024%2C834&amp;ssl=1 1024w, https://i0.wp.com/highearthorbit.com/wp-content/uploads/2024/02/image-3.png?resize=300%2C244&amp;ssl=1 300w, https://i0.wp.com/highearthorbit.com/wp-content/uploads/2024/02/image-3.png?resize=768%2C626&amp;ssl=1 768w, https://i0.wp.com/highearthorbit.com/wp-content/uploads/2024/02/image-3.png?resize=1536%2C1252&amp;ssl=1 1536w, https://i0.wp.com/highearthorbit.com/wp-content/uploads/2024/02/image-3.png?resize=2048%2C1669&amp;ssl=1 2048w, https://i0.wp.com/highearthorbit.com/wp-content/uploads/2024/02/image-3.png?w=1680&amp;ssl=1 1680w, https://i0.wp.com/highearthorbit.com/wp-content/uploads/2024/02/image-3.png?w=2520&amp;ssl=1 2520w" sizes="auto, (max-width: 840px) 100vw, 840px" /><figcaption class="wp-element-caption">The Hub AI Assistant supports any language for requests and information.</figcaption></figure>


<h2 class="wp-block-heading">Survey123 Assistant</h2>


<p class="wp-block-paragraph">Survey123 is a powerful capability for creating dynamic forms to gather information. However, researching and formulating questions and answers can take significant time. Then we need to configure the form with all the details.</p>


<p class="wp-block-paragraph">The upcoming Survey123 Assistant accelerates your work. We can request it to “<strong>create a survey for reporting damage assessments due to flooding</strong>”. The Survey123 Assistant creates a draft survey based on training using domain knowledge relevant to the request and prompt engineering for best practices. Within a few seconds we have a suggested set of questions and answers.</p>


<figure class="wp-block-image size-large"><img data-recalc-dims="1" loading="lazy" decoding="async" width="840" height="665" src="https://i0.wp.com/highearthorbit.com/wp-content/uploads/2024/02/image-4.png?resize=840%2C665&#038;ssl=1" alt="" class="wp-image-385" srcset="https://i0.wp.com/highearthorbit.com/wp-content/uploads/2024/02/image-4.png?resize=1024%2C811&amp;ssl=1 1024w, https://i0.wp.com/highearthorbit.com/wp-content/uploads/2024/02/image-4.png?resize=300%2C238&amp;ssl=1 300w, https://i0.wp.com/highearthorbit.com/wp-content/uploads/2024/02/image-4.png?resize=768%2C608&amp;ssl=1 768w, https://i0.wp.com/highearthorbit.com/wp-content/uploads/2024/02/image-4.png?resize=1536%2C1217&amp;ssl=1 1536w, https://i0.wp.com/highearthorbit.com/wp-content/uploads/2024/02/image-4.png?resize=2048%2C1622&amp;ssl=1 2048w, https://i0.wp.com/highearthorbit.com/wp-content/uploads/2024/02/image-4.png?resize=150%2C120&amp;ssl=1 150w, https://i0.wp.com/highearthorbit.com/wp-content/uploads/2024/02/image-4.png?w=1680&amp;ssl=1 1680w, https://i0.wp.com/highearthorbit.com/wp-content/uploads/2024/02/image-4.png?w=2520&amp;ssl=1 2520w" sizes="auto, (max-width: 840px) 100vw, 840px" /></figure>


<p class="wp-block-paragraph">We can modify this to “<strong>add a map for marking the location</strong>”. The assistant will consider my request, update the questions and answers, then provide a complete draft for me to review.</p>


<p class="wp-block-paragraph">When we’re satisfied with this draft the Survey123 Assistant can Generate the form automatically. Now we can continue working in the form editor to make changes, share with colleagues and publish when we’re confident.</p>


<figure class="wp-block-image size-large"><img data-recalc-dims="1" loading="lazy" decoding="async" width="840" height="665" src="https://i0.wp.com/highearthorbit.com/wp-content/uploads/2024/02/image-5.png?resize=840%2C665&#038;ssl=1" alt="" class="wp-image-386" srcset="https://i0.wp.com/highearthorbit.com/wp-content/uploads/2024/02/image-5.png?resize=1024%2C811&amp;ssl=1 1024w, https://i0.wp.com/highearthorbit.com/wp-content/uploads/2024/02/image-5.png?resize=300%2C238&amp;ssl=1 300w, https://i0.wp.com/highearthorbit.com/wp-content/uploads/2024/02/image-5.png?resize=768%2C608&amp;ssl=1 768w, https://i0.wp.com/highearthorbit.com/wp-content/uploads/2024/02/image-5.png?resize=1536%2C1217&amp;ssl=1 1536w, https://i0.wp.com/highearthorbit.com/wp-content/uploads/2024/02/image-5.png?resize=2048%2C1622&amp;ssl=1 2048w, https://i0.wp.com/highearthorbit.com/wp-content/uploads/2024/02/image-5.png?resize=150%2C120&amp;ssl=1 150w, https://i0.wp.com/highearthorbit.com/wp-content/uploads/2024/02/image-5.png?w=1680&amp;ssl=1 1680w, https://i0.wp.com/highearthorbit.com/wp-content/uploads/2024/02/image-5.png?w=2520&amp;ssl=1 2520w" sizes="auto, (max-width: 840px) 100vw, 840px" /></figure>


<p class="wp-block-paragraph">These are just two examples of our research and development efforts integrating generative AI into new AI Assistants.</p>


<p class="wp-block-paragraph">We are testing these AI Assistants for ArcGIS with different users and organizations to progressively improve their quality, utility, and accessibility. </p>]]></content><author><name>Andrew Turner</name></author><category term="Geo" /><category term="Technology" /><category term="ArcGIS" /><category term="ArcGIS Hub" /><category term="augmented reality" /><category term="civic" /><category term="conference" /><summary type="html"><![CDATA[Last week, I shared our work at Esri adding generative AI to ArcGIS. Over the past year, I&#8217;ve been leading a new ArcGIS Hub AI Assistant in close collaboration with the city of Washington, DC to support easy access and understanding of open data about the city. This work builds from my talk at the National Academies on the future of GeoAI and the potential for improved access to information.]]></summary></entry><entry><title type="html">Back to Baltimore for FOSS4G</title><link href="https://highearthorbit.com/articles/back-to-baltimore-for-foss4g/" rel="alternate" type="text/html" title="Back to Baltimore for FOSS4G" /><published>2023-11-04T18:25:00-04:00</published><updated>2023-11-04T18:25:00-04:00</updated><id>https://highearthorbit.com/articles/back-to-baltimore-for-foss4g</id><content type="html" xml:base="https://highearthorbit.com/articles/back-to-baltimore-for-foss4g/"><![CDATA[<p class="wp-block-paragraph">Baltimore hosted the&nbsp;<a href="https://foss4gna.org/">2023 Free + Open Source Software for Geospatial (FOSS4G) North America conference</a>, a geeky tech gathering focused on mapping technology and an even more eclectic community. While I have attended many FOSS4G events since the&nbsp;<a href="https://2006.foss4g.org/contributionDisplayc270.html?contribId=189&amp;sessionId=46&amp;confId=1">first in 2006 in Lausanne, Switzerland</a>&nbsp;it&#8217;s been a few years. It was terrific to see so many delightful people in person again to share ideas and brainstorm the future. It was particularly delightful to ride the MARC train from DC Union Station to Camden Yards &#8211; city-to-city in under an hour for $9!</p>


<p class="wp-block-paragraph">Sessions ranged from long-standing projects like&nbsp;<a href="https://www.qgis.org/en/site/">QGIS</a>,&nbsp;<a href="https://openlayers.org/">Open Layers</a>, and&nbsp;<a href="https://postgis.net/">PostGIS</a>&nbsp;to newer technology and work</p>


<p class="wp-block-paragraph">To track all of the evolving technology,&nbsp;<a href="https://www.linkedin.com/in/rcheetham">Robert Cheetham</a>&nbsp;(of Azavea, now at Element84) shared a tremendously useful &#8220;<a href="https://element84.com/geospatial-tech-radar-23/#">Geospatial Technology Radar</a>&#8221; that his team compiled over the past 6-months. Modeled on&nbsp;<a href="https://www.thoughtworks.com/en-us/radar">ThoughtWorks&#8217; long-standing Technology Radar</a>, this geospatial lens provides a good overview of the best and emerging platforms, standards, data, and processes for you to check out.</p>


<h2 class="wp-block-heading" id="koopjs-presentation">Koop.JS Presentation</h2>


<p class="wp-block-paragraph">I presented on the&nbsp;<a href="https://koopjs.github.io/">Koop.js open-source geospatial API adapter project</a>. Koop.js is used in various products across Esri, governments, and other technology platforms to dynamically query various API into common formats. For example, you can have an OGC Features API for GeoJSON from GithHub, ArcGIS Feature Layers, Elastic, Snowflake DB, and even consumer platforms like Yelp, Craigslist, or Zillow. There is an active community of Koop.js plugins that can be mixed and matched together.</p>


<p class="wp-block-paragraph"><a href="https://ajturner.github.io/koopjs-foss4g-2023/">See my presentation here</a>.</p>


<figure class="wp-block-image size-large"><img data-recalc-dims="1" loading="lazy" decoding="async" width="840" height="546" src="https://i0.wp.com/highearthorbit.com/wp-content/uploads/2023/11/image.png?resize=840%2C546&#038;ssl=1" alt="" class="wp-image-367" srcset="https://i0.wp.com/highearthorbit.com/wp-content/uploads/2023/11/image.png?resize=1024%2C666&amp;ssl=1 1024w, https://i0.wp.com/highearthorbit.com/wp-content/uploads/2023/11/image.png?resize=300%2C195&amp;ssl=1 300w, https://i0.wp.com/highearthorbit.com/wp-content/uploads/2023/11/image.png?resize=768%2C500&amp;ssl=1 768w, https://i0.wp.com/highearthorbit.com/wp-content/uploads/2023/11/image.png?resize=1536%2C1000&amp;ssl=1 1536w, https://i0.wp.com/highearthorbit.com/wp-content/uploads/2023/11/image.png?resize=2048%2C1333&amp;ssl=1 2048w, https://i0.wp.com/highearthorbit.com/wp-content/uploads/2023/11/image.png?w=1680&amp;ssl=1 1680w" sizes="auto, (max-width: 840px) 100vw, 840px" /></figure>


<h2 class="wp-block-heading" id="esri-using--supporting-open-source">Esri using + supporting open-source</h2>


<p class="wp-block-paragraph">I&#8217;m particularly proud of the support Esri has provided to the open-source communities over the past decade. There are now over <a href="https://esri.github.io/">600 open-source Esri supported projects on GitHub</a>. We also document and support integration with <a href="https://developers.arcgis.com/openlayers/">OpenLayers</a>, <a href="https://developers.arcgis.com/esri-leaflet/">Leaflet</a>, <a href="https://developers.arcgis.com/cesiumjs/">Cesium</a>, and <a href="https://developers.arcgis.com/maplibre-gl-js/">MapLibre</a> (née Mapbox GL). A few of my colleagues, <a href="https://www.linkedin.com/in/courtneyyatteau/" target="_blank" rel="noopener" title="">Courtney Yatteau</a> and <a href="https://www.linkedin.com/in/geoowen/" target="_blank" rel="noopener" title="">George Owen</a>, presented an &#8220;Open Source Mapping Library Shootout&#8221; which highlighted the relative feature capabilities and performance across these community maintained libraries.</p>


<p class="wp-block-paragraph">In the closing Keynote, Paul Ramsey highlighted that Esri has steadfastly remained a monetary contributor to core open-source projects such as GDAL. It&#8217;s imperative that organizations support these open-source projects to ensure proper maintenance, high quality, and fixing security issues.</p>


<figure class="wp-block-image size-large"><img data-recalc-dims="1" loading="lazy" decoding="async" width="840" height="348" src="https://i0.wp.com/highearthorbit.com/wp-content/uploads/2023/11/image-1.png?resize=840%2C348&#038;ssl=1" alt="" class="wp-image-368" srcset="https://i0.wp.com/highearthorbit.com/wp-content/uploads/2023/11/image-1.png?resize=1024%2C424&amp;ssl=1 1024w, https://i0.wp.com/highearthorbit.com/wp-content/uploads/2023/11/image-1.png?resize=300%2C124&amp;ssl=1 300w, https://i0.wp.com/highearthorbit.com/wp-content/uploads/2023/11/image-1.png?resize=768%2C318&amp;ssl=1 768w, https://i0.wp.com/highearthorbit.com/wp-content/uploads/2023/11/image-1.png?resize=1536%2C636&amp;ssl=1 1536w, https://i0.wp.com/highearthorbit.com/wp-content/uploads/2023/11/image-1.png?resize=2048%2C848&amp;ssl=1 2048w, https://i0.wp.com/highearthorbit.com/wp-content/uploads/2023/11/image-1.png?w=1680&amp;ssl=1 1680w, https://i0.wp.com/highearthorbit.com/wp-content/uploads/2023/11/image-1.png?w=2520&amp;ssl=1 2520w" sizes="auto, (max-width: 840px) 100vw, 840px" /><figcaption class="wp-element-caption">Courtney Yatteau and George Owen presenting an Open Source Mapping Library Shoot-out</figcaption></figure>


<h2 class="wp-block-heading" id="making-open-source-easy-to-use-and-powerful">Making Open-Source Easy to Use and Powerful</h2>


<p class="wp-block-paragraph">There were numerous compelling presentations, ranging between project specific details, applied use cases, and community standards + processes.&nbsp;<a href="https://www.projectgeospatial.com/foss4gna2023">The recordings will be posted here</a>.</p>


<p class="wp-block-paragraph">A few highlights to check out:</p>


<ul class="wp-block-list">
<li><a href="https://www.linkedin.com/in/catherine-oldershaw/">Catherine Oldershaw</a>&nbsp;of Element84 advocated for UX simplicity to &#8220;meet the user&#8217;s mental model&#8221; and complete their &#8220;job to be done&#8221;</li>


<li>Advanced optimizations for PostGIS by Paul Ramsey of Crunch Data and and data visualization by</li>


<li>Robert Cheetham of Element84 shared the aforementioned Geospatial Technology Radar</li>


<li><a href="https://geog.umd.edu/facultyprofile/oshan/taylor">Taylor Oshan</a>&nbsp;of University of Maryland brainstormed on applications of distributed open data (EASIER project) and &#8220;proof of location&#8221; in GeoBlockchain</li>


<li>New high-performance data stores like&nbsp;<a href="https://sedona.apache.org/">Apache Sedona</a></li>


<li>Emerging standard architectures like&nbsp;<a href="https://cloudnativegeo.org/">Cloud-Native Geospatial foundation</a>&nbsp;by&nbsp;<a href="https://www.linkedin.com/in/jedsundwall/">Jed Sundwall</a>&nbsp;of Radiant Earth</li>


<li>History of FOSS4G by&nbsp;<a href="https://github.com/spara">Sophia Parafina</a></li>
</ul>


<figure class="wp-block-image size-large"><img data-recalc-dims="1" loading="lazy" decoding="async" width="840" height="381" src="https://i0.wp.com/highearthorbit.com/wp-content/uploads/2023/11/image-2.png?resize=840%2C381&#038;ssl=1" alt="" class="wp-image-369" srcset="https://i0.wp.com/highearthorbit.com/wp-content/uploads/2023/11/image-2.png?resize=1024%2C464&amp;ssl=1 1024w, https://i0.wp.com/highearthorbit.com/wp-content/uploads/2023/11/image-2.png?resize=300%2C136&amp;ssl=1 300w, https://i0.wp.com/highearthorbit.com/wp-content/uploads/2023/11/image-2.png?resize=768%2C348&amp;ssl=1 768w, https://i0.wp.com/highearthorbit.com/wp-content/uploads/2023/11/image-2.png?resize=1536%2C696&amp;ssl=1 1536w, https://i0.wp.com/highearthorbit.com/wp-content/uploads/2023/11/image-2.png?resize=2048%2C927&amp;ssl=1 2048w, https://i0.wp.com/highearthorbit.com/wp-content/uploads/2023/11/image-2.png?w=1680&amp;ssl=1 1680w" sizes="auto, (max-width: 840px) 100vw, 840px" /></figure>


<p class="wp-block-paragraph">There were many other terrific talks, topics, and people. I&#8217;m eager to see how these projects grow, integrate, and are applied to support complex problems.</p>]]></content><author><name>Andrew Turner</name></author><category term="Geo" /><category term="conference" /><category term="esri" /><category term="open source" /><summary type="html"><![CDATA[Baltimore hosted the&nbsp;2023 Free + Open Source Software for Geospatial (FOSS4G) North America conference, a geeky tech gathering focused on mapping technology and an even more eclectic community. While I have attended many FOSS4G events since the&nbsp;first in 2006 in Lausanne, Switzerland&nbsp;it&#8217;s been a few years. It was terrific to see so many delightful people in person again to share ideas and brainstorm the future. It was particularly delightful to ride the MARC train from DC Union Station to Camden Yards &#8211; city-to-city in under an hour for $9!]]></summary></entry><entry><title type="html">GeoAI and the Future of Mapping</title><link href="https://highearthorbit.com/articles/geoai-and-the-future-of-mapping/" rel="alternate" type="text/html" title="GeoAI and the Future of Mapping" /><published>2023-05-22T12:58:00-04:00</published><updated>2023-05-22T12:58:00-04:00</updated><id>https://highearthorbit.com/articles/geoai-and-the-future-of-mapping</id><content type="html" xml:base="https://highearthorbit.com/articles/geoai-and-the-future-of-mapping/"><![CDATA[<p class="wp-block-paragraph">I spoke at the U.S. National Academies of Science, Engineering, and Medicine on the rapid emergence of &#8220;GeoAI&#8221; and the potential future of mapping. In particular, I focused on &#8220;Resiliency through Accessibility&#8221;</p>


<iframe loading="lazy" width="560" height="315" src="https://www.youtube.com/embed/zYSEOML_0Xo?si=1hF6wUgemqqnRqoC&amp;start=16715" title="YouTube video player" frameborder="0" allow="accelerometer; autoplay; clipboard-write; encrypted-media; gyroscope; picture-in-picture; web-share" allowfullscreen></iframe>


<p class="wp-block-paragraph"><a href="https://www.youtube.com/watch?v=zYSEOML_0Xo&amp;t=16715s" title="">Video Link</a></p>


<p class="wp-block-paragraph">My primary premise is that <em>AI is not New</em> &#8211; but that AI has become a lot easier to use. It will be rapidly integrated across all technologies and workflows to automated and accelerate work.</p>


<h2 class="wp-block-heading">Language is the new Interface</h2>


<p class="wp-block-paragraph">Newer generative AI improves accessibility by allowing natural language interfaces to any machine &#8211; without need for coding or concern for particular standards. </p>


<figure class="wp-block-image size-large"><img data-recalc-dims="1" loading="lazy" decoding="async" width="840" height="471" src="https://i0.wp.com/highearthorbit.com/wp-content/uploads/2024/02/image-8.png?resize=840%2C471&#038;ssl=1" alt="" class="wp-image-393" srcset="https://i0.wp.com/highearthorbit.com/wp-content/uploads/2024/02/image-8.png?resize=1024%2C574&amp;ssl=1 1024w, https://i0.wp.com/highearthorbit.com/wp-content/uploads/2024/02/image-8.png?resize=300%2C168&amp;ssl=1 300w, https://i0.wp.com/highearthorbit.com/wp-content/uploads/2024/02/image-8.png?resize=768%2C431&amp;ssl=1 768w, https://i0.wp.com/highearthorbit.com/wp-content/uploads/2024/02/image-8.png?resize=1536%2C861&amp;ssl=1 1536w, https://i0.wp.com/highearthorbit.com/wp-content/uploads/2024/02/image-8.png?resize=2048%2C1148&amp;ssl=1 2048w, https://i0.wp.com/highearthorbit.com/wp-content/uploads/2024/02/image-8.png?w=1680&amp;ssl=1 1680w" sizes="auto, (max-width: 840px) 100vw, 840px" /><figcaption class="wp-element-caption">Accessibility as Interoperability</figcaption></figure>


<h2 class="wp-block-heading">Composing AI</h2>


<p class="wp-block-paragraph">AI systems will be composed of various components that are orchestrated to use specialized knowledge and appropriate data.</p>


<figure class="wp-block-image size-large"><img data-recalc-dims="1" loading="lazy" decoding="async" width="840" height="471" src="https://i0.wp.com/highearthorbit.com/wp-content/uploads/2024/02/image-7.png?resize=840%2C471&#038;ssl=1" alt="" class="wp-image-392" srcset="https://i0.wp.com/highearthorbit.com/wp-content/uploads/2024/02/image-7.png?resize=1024%2C574&amp;ssl=1 1024w, https://i0.wp.com/highearthorbit.com/wp-content/uploads/2024/02/image-7.png?resize=300%2C168&amp;ssl=1 300w, https://i0.wp.com/highearthorbit.com/wp-content/uploads/2024/02/image-7.png?resize=768%2C431&amp;ssl=1 768w, https://i0.wp.com/highearthorbit.com/wp-content/uploads/2024/02/image-7.png?resize=1536%2C861&amp;ssl=1 1536w, https://i0.wp.com/highearthorbit.com/wp-content/uploads/2024/02/image-7.png?resize=2048%2C1148&amp;ssl=1 2048w, https://i0.wp.com/highearthorbit.com/wp-content/uploads/2024/02/image-7.png?w=1680&amp;ssl=1 1680w" sizes="auto, (max-width: 840px) 100vw, 840px" /></figure>


<h2 class="wp-block-heading">GeoAI at Scale: <em>Some Recommendations</em></h2>


<ul class="wp-block-list">
<li>Pre-position Open Data with integrated, federated networks</li>


<li>Orchestrate AI through composition and &#8216;interoperability&#8217;</li>


<li>Create accessible, open, local user interfaces</li>


<li>Standardized Testing, Validation, and Accreditation of AI models + agents</li>
</ul>]]></content><author><name>Andrew Turner</name></author><category term="Geo" /><category term="Technology" /><category term="AI" /><category term="Generative AI" /><category term="GeoAI" /><summary type="html"><![CDATA[I spoke at the U.S. National Academies of Science, Engineering, and Medicine on the rapid emergence of &#8220;GeoAI&#8221; and the potential future of mapping. In particular, I focused on &#8220;Resiliency through Accessibility&#8221;]]></summary></entry><entry><title type="html">The Hidden Costs of Daylight Saving Time</title><link href="https://highearthorbit.com/articles/the-hidden-costs-of-daylight-saving-time/" rel="alternate" type="text/html" title="The Hidden Costs of Daylight Saving Time" /><published>2023-03-13T20:48:00-04:00</published><updated>2023-03-13T20:48:00-04:00</updated><id>https://highearthorbit.com/articles/the-hidden-costs-of-daylight-saving-time</id><content type="html" xml:base="https://highearthorbit.com/articles/the-hidden-costs-of-daylight-saving-time/"><![CDATA[<p class="wp-block-paragraph">Most people across the U.S. lost an hour of sleep last weekend. While the reason is the simple “spring forward” to <a href="https://en.wikipedia.org/wiki/Daylight_saving_time?wprov=sfti1">Daylight Saving Time (DST)</a>, there are also significant hidden costs to time changes which should make us all lose more sleep.</p>


<h2 class="wp-block-heading">DST is like a bad Product Manager</h2>


<p class="wp-block-paragraph">In 1784, <a href="https://www.fi.edu/en/benjamin-franklin/daylight-savings-time">Benjamin Franklin suggested</a> that Parisians change their sleep schedules to save candles and lamp oil. However, Daylight Saving Time is a relatively new invention. The Germans originally devised Daylight Saving Time (DST) in 1916 in an effort to conserve energy during World War I. The U.S. formally adopted the <a href="https://en.wikipedia.org/wiki/Uniform_Time_Act?wprov=sfti1">Uniform Time Act</a> in 1966, though States retain the ability to opt-out (e.g. Arizona and Hawaii). </p>


<figure class="wp-block-image size-full"><img data-recalc-dims="1" loading="lazy" decoding="async" width="816" height="574" src="https://i0.wp.com/highearthorbit.com/wp-content/uploads/2023/03/image-1.png?resize=816%2C574&#038;ssl=1" alt="" class="wp-image-334" srcset="https://i0.wp.com/highearthorbit.com/wp-content/uploads/2023/03/image-1.png?w=816&amp;ssl=1 816w, https://i0.wp.com/highearthorbit.com/wp-content/uploads/2023/03/image-1.png?resize=300%2C211&amp;ssl=1 300w, https://i0.wp.com/highearthorbit.com/wp-content/uploads/2023/03/image-1.png?resize=768%2C540&amp;ssl=1 768w" sizes="auto, (max-width: 816px) 100vw, 816px" /><figcaption class="wp-element-caption">Daylight Saving Time (DST) by Country. Source: <a href="https://en.wikipedia.org/wiki/Daylight_saving_time_by_country" title="">Wikipedia</a></figcaption></figure>


<p class="wp-block-paragraph">Even more confusing is that DST, like Timezones, varies across the world by country and administrations. There are currently 13 different daylight saving time definitions, including Lord Howe Island, Australia that varies by just 30 minutes!</p>


<p class="wp-block-paragraph">In 2005, Congress extended DST by 4-weeks. Ostensibly to conserve energy. But since the shift was from the last Sunday in October to the first Sunday in November, it is widely assumed that &#8220;Big Candy&#8221; lobbied for more Halloween “trick-or-treat&#8221; time and therefore more candy sales.</p>


<p class="wp-block-paragraph">The <a href="https://www1.eere.energy.gov/ba/pba/pdfs/edst_national_energy_consumption.pdf">U.S. Department of Energy reported in 2008</a> that the additional weeks of DST saved 1.3 Tera Watt-hours of electricity, approximately 0.03% of the national electricity usage in an entire year. The total cost saved was estimated at $84 million.. </p>


<p class="wp-block-paragraph">These efforts are for the stated goal of reducing costs and increasing happiness. But what if DST is doing the opposite &#8211; costing more money and making people miserable. In 2016,<a href="https://www.yahoo.com/lifestyle/real-cost-daylight-savings-2023-140115498.html"> research reports estimated </a>that Daylight Saving Time could <strong>cost the U.S. between $430 million to $1.7 billion per year</strong> due to lost productivity, physical injury, and<strong> </strong>other livelihood or productivity setbacks.</p>


<p class="wp-block-paragraph">Hidden from view are the bugs in software that increasingly are powering, and bringing down, power grids, transportation systems, banks, and governments. However, there are many signals that there is an even higher significant economic and health cost to DST and related time changes. </p>


<p class="wp-block-paragraph">We likely all know about Y2K which did not cause major issues thanks to planning and updates ahead of this singular event. Now consider that same scenario repeated every few years and across governments. Since 2015, at least 45 U.S. States are considering changing their use of DST &#8211; a pending wave of ad-hoc changes that could have significant impact on software reliability.</p>


<h2 class="wp-block-heading">Unstable Code in an Unstable Time</h2>


<div class="wp-block-image">
<figure class="alignright size-full is-resized"><a href="https://www.flickr.com/photos/kowitz/2012117209"><img data-recalc-dims="1" loading="lazy" decoding="async" src="https://i0.wp.com/highearthorbit.com/wp-content/uploads/2023/03/image.png?resize=176%2C256&#038;ssl=1" alt="" class="wp-image-324" width="176" height="256" srcset="https://i0.wp.com/highearthorbit.com/wp-content/uploads/2023/03/image.png?w=702&amp;ssl=1 702w, https://i0.wp.com/highearthorbit.com/wp-content/uploads/2023/03/image.png?resize=206%2C300&amp;ssl=1 206w" sizes="auto, (max-width: 176px) 100vw, 176px" /></a><figcaption class="wp-element-caption">Complicated Parking <br>Photo: Flickr @kowitz</figcaption></figure>
</div>


<p class="wp-block-paragraph">Engineering aims to build &amp; maintain stable solutions that people can rely upon. Software in particular operates in a various environments that do not always fit a simple model. While this is just <em>part of the responsibility for engineering</em>, when the requirements are constantly changing it can be <em>difficult</em>, and expensive, to ensure things work as expected. </p>


<p class="wp-block-paragraph">Time is already a complicated domain to develop correct, maintainable software. I once heard about a software engineering interview question that asked developer candidates how they would design and implement an algorithm for a recurring calendar event based on Boston parking signs. </p>


<p class="wp-block-paragraph">Now consider when <strong>the rules of time vary by geographic location, day of the year, and changing policies</strong>. This is a ripe condition for both bugs as well as confusing user experiences. </p>


<p class="wp-block-paragraph">This is compounded because Software doesn&#8217;t have physical restrictions. Code needs to work consistently based on static, dynamic, and semantic conditions. </p>


<ol class="wp-block-list">
<li>when &amp; where the user is located</li>


<li>when &amp; where they&#8217;re interacting with</li>


<li>the policies at that future or past location + time</li>


<li>continue to work as the user moves through time + space!</li>
</ol>


<p class="wp-block-paragraph">There are emerging, publicly available examples where DST and time changes are causing significant issues. I&#8217;ve found a few worth highlighting&#8230;</p>


<ul class="wp-block-list">
<li><a title="" href="https://www.theregister.com/2022/09/07/microsoft_windows_chile_time_change/">Microsoft warns national governments about bugs due to DST changes</a>. Microsoft now has a “<a href="https://techcommunity.microsoft.com/t5/daylight-saving-time-time-zone/bg-p/DSTBlog">DST Blog</a>” and <a href="https://learn.microsoft.com/en-US/troubleshoot/windows-client/system-management-components/daylight-saving-time-help-support">help docs</a>.</li>


<li><a href="https://9to5mac.com/2021/11/01/iphone-users-in-canada-affected-by-dst-bug-causing-ios-to-show-the-wrong-time/">Apple iOS users across Canada had clocks off by an hour </a>&#8211; which coincided with European, but not Canadian, DST change. <a href="https://www.idownloadblog.com/2018/10/08/apple-watch-daylight-saving-time-bug/">There have been similar Apple Watch issues. </a></li>


<li>Schneider Electric, a $34-billion annual revenue power company, discovered a <a href="https://www.se.com/ww/en/faqs/FA369214/" title="">bug in their power meters</a> that requires a patch update. </li>


<li>MySQL, one of the most popular databases across the world used in commercial and consumer software systems,<a href="https://twitter.com/aaronpk/status/1634753099150823425?s=46&amp;t=4B1aijHTQagrZg33fORxDA"> has erratic DST behavior</a></li>
</ul>


<p class="wp-block-paragraph">There are likely many more publicly available, and internally confidential, time-related bugs that are not readily disclosed. However, there is continuing evidence where workers, even in life-threatening scenarios, are required to work around bugs with DST.</p>


<h2 class="wp-block-heading">Were you alive between 1-2am last night?</h2>


<p class="wp-block-paragraph">During Daylight Saving time changes, some medical staff opt for paper records because <a href="https://www.fiercehealthcare.com/hospitals-health-systems/how-daylight-saving-time-stumps-hospital-record-keeping">Healthcare systems can result in deleted records</a>.</p>


<p class="wp-block-paragraph">Hospital staff have learned to deal with it by taking extra chart notes by hand. ICU Nurses “come to expect that the vitals she enters into the system from 1 a.m. to 2 a.m. will be deleted when the clock falls back to 1 a.m. One hour’s worth of electronic record keeping “is gone,” she said.”</p>


<p class="wp-block-paragraph">Sometimes, people just work around the software bugs. John’s Hopkins Hospital and Cleveland Clinic “enter vitals at 1 a.m. and then when the clock falls back an hour later and they have to enter new vitals, they list them at 1:01 a.m. They leave a note that it’s an hour later, not a minute later.“</p>


<h2 class="wp-block-heading">Calculating the cost</h2>


<p class="wp-block-paragraph">To the original point &#8211; what is the total cost of Daylight Saving Time changes? </p>


<p class="wp-block-paragraph">I couldn&#8217;t find a summary analysis of the cost due to bugs caused by DST, there are some parallels. Software bugs caused by Y2K was <a href="https://www.cnet.com/tech/tech-industry/y2k-cost-estimate-cut-by-2-billion/">estimated to cost $21 billion</a> in 2002 and the <a href="https://www.nytimes.com/2007/03/05/technology/05daylight.html">2005 DST change cost $350 million</a>. Overall, <a href="https://www.synopsys.com/software-integrity/resources/analyst-reports/cost-poor-quality-software.html?intcmp=sig-blog-cisq22">some estimates of overall software bugs exceeds $2 trillion per year</a>. </p>


<p class="wp-block-paragraph">While not all bugs are caused by DST and time-related issues, as software increasingly powers all of our systems the costs, and related impacts, will continue to grow.</p>


<p class="wp-block-paragraph">If you want to learn more details about the history and policy implications of Daylight Saving Time then I recommend reading the <a href="https://crsreports.congress.gov/product/details?prodcode=R45208" title="">2020 Congressional Research Report</a>. <em>Disclaimer: one of the authors is my spouse, so you can imagine the geekiness of our family conversations.</em></p>


<p class="wp-block-paragraph">You can also explore Andy Woodruff&#8217;s <a href="https://observablehq.com/@awoodruff/daylight-saving-time-gripe-assistant-tool" title="">Daylight Saving Time Gripe Assistant Tool</a> and <a href="https://andywoodruff.com/blog/where-to-hate-daylight-saving-time-and-where-to-love-it/" title="">his explanation</a> to evaluate your preferences and personal effects of DST.</p>


<figure class="wp-block-image size-large"><img data-recalc-dims="1" loading="lazy" decoding="async" width="840" height="515" src="https://i0.wp.com/highearthorbit.com/wp-content/uploads/2023/03/image-2.png?resize=840%2C515&#038;ssl=1" alt="" class="wp-image-336" srcset="https://i0.wp.com/highearthorbit.com/wp-content/uploads/2023/03/image-2.png?resize=1024%2C628&amp;ssl=1 1024w, https://i0.wp.com/highearthorbit.com/wp-content/uploads/2023/03/image-2.png?resize=300%2C184&amp;ssl=1 300w, https://i0.wp.com/highearthorbit.com/wp-content/uploads/2023/03/image-2.png?resize=768%2C471&amp;ssl=1 768w, https://i0.wp.com/highearthorbit.com/wp-content/uploads/2023/03/image-2.png?resize=1536%2C942&amp;ssl=1 1536w, https://i0.wp.com/highearthorbit.com/wp-content/uploads/2023/03/image-2.png?resize=2048%2C1256&amp;ssl=1 2048w, https://i0.wp.com/highearthorbit.com/wp-content/uploads/2023/03/image-2.png?w=1680&amp;ssl=1 1680w" sizes="auto, (max-width: 840px) 100vw, 840px" /><figcaption class="wp-element-caption"><a href="https://observablehq.com/@awoodruff/daylight-saving-time-gripe-assistant-tool" title="">Daylight Saving Time Gripe Assistance Tool</a> by <a href="https://andywoodruff.com/" title="">Andy Woodruff</a></figcaption></figure>


<p class="wp-block-paragraph"></p>


<p class="wp-block-paragraph"></p>


<p class="wp-block-paragraph"></p>


<p class="wp-block-paragraph"></p>


<p class="wp-block-paragraph"><a href="https://crsreports.congress.gov/product/details?prodcode=R45208">https://crsreports.congress.gov/product/details?prodcode=R45208</a></p>]]></content><author><name>Andrew Turner</name></author><category term="Technology" /><summary type="html"><![CDATA[Most people across the U.S. lost an hour of sleep last weekend. While the reason is the simple “spring forward” to Daylight Saving Time (DST), there are also significant hidden costs to time changes which should make us all lose more sleep.]]></summary></entry><entry><title type="html">Highlight Government Hubs at FedGIS 2023</title><link href="https://highearthorbit.com/articles/highlight-government-hubs-at-fedgis-2023/" rel="alternate" type="text/html" title="Highlight Government Hubs at FedGIS 2023" /><published>2023-02-24T16:15:00-05:00</published><updated>2023-02-24T16:15:00-05:00</updated><id>https://highearthorbit.com/articles/highlight-government-hubs-at-fedgis-2023</id><content type="html" xml:base="https://highearthorbit.com/articles/highlight-government-hubs-at-fedgis-2023/"><![CDATA[<p class="wp-block-paragraph">Esri recently hosted our annual Federal GIS conference. Experts from across National, Regional, and Local governments attend to learn and share their work using spatial analysis to evaluate and implement effective policies. This was our largest ever conference, a welcome reconnection with people after a few years of the pandemic.</p>


<p class="wp-block-paragraph">The conference kicks off with a <a href="https://mediaspace.esri.com/media/t/1_vno2pvdg">plenary session</a> where organizations highlight their mission and how our technology helps them work together to achieve better outcomes. I find these stories inspiring in the dedication of the people on important problems facing society &#8211; from Wildfire response to Climate Change to Humanitarian Response and hundreds of other missions.</p>


<p class="wp-block-paragraph">In particular to my and my teams&#8217; work, I learned about several examples of <a href="https://esri.com/hub">ArcGIS Hub</a> to share information and coordinate ad-hoc collaboration. I want to highlight a few, you can watch the videos to hear their stories directly.</p>


<h2 class="wp-block-heading">U.S. White House Climate Resilience</h2>


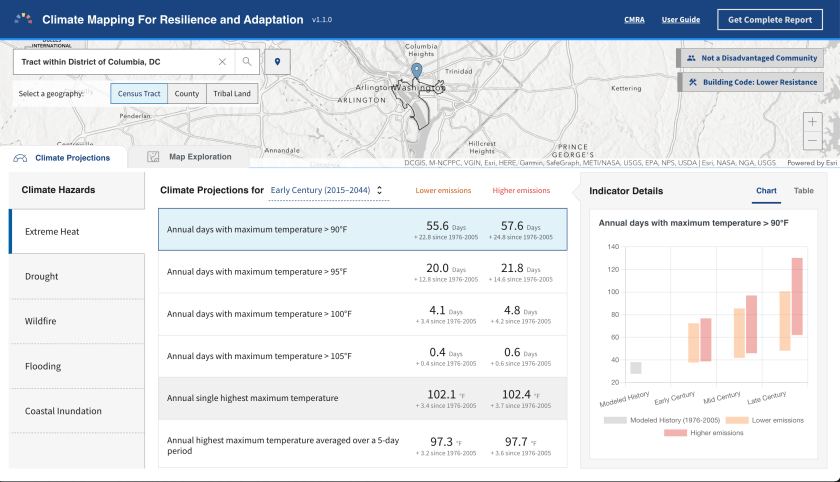
<p class="wp-block-paragraph">The U.S. White House showcased the recently launched <a href="https://resilience.climate.gov/">Climate Mapping for Resilience and Adaptation</a> (CRMA), a Hub for anyone to understand local climate impacts. <a href="https://livingatlas.arcgis.com/assessment-tool/explore/details">Visitors can explore</a> extreme heat, drought, wildfire, flooding, and other hazards.</p>


<figure class="wp-block-image size-large"><a href="https://livingatlas.arcgis.com/assessment-tool/search"><img data-recalc-dims="1" loading="lazy" decoding="async" width="840" height="482" src="https://i0.wp.com/highearthorbit.com/wp-content/uploads/2023/02/image.png?resize=840%2C482&#038;ssl=1" alt="" class="wp-image-308" srcset="https://i0.wp.com/highearthorbit.com/wp-content/uploads/2023/02/image.png?resize=1024%2C587&amp;ssl=1 1024w, https://i0.wp.com/highearthorbit.com/wp-content/uploads/2023/02/image.png?resize=300%2C172&amp;ssl=1 300w, https://i0.wp.com/highearthorbit.com/wp-content/uploads/2023/02/image.png?resize=768%2C440&amp;ssl=1 768w, https://i0.wp.com/highearthorbit.com/wp-content/uploads/2023/02/image.png?resize=1536%2C881&amp;ssl=1 1536w, https://i0.wp.com/highearthorbit.com/wp-content/uploads/2023/02/image.png?resize=2048%2C1174&amp;ssl=1 2048w, https://i0.wp.com/highearthorbit.com/wp-content/uploads/2023/02/image.png?w=1680&amp;ssl=1 1680w, https://i0.wp.com/highearthorbit.com/wp-content/uploads/2023/02/image.png?w=2520&amp;ssl=1 2520w" sizes="auto, (max-width: 840px) 100vw, 840px" /></a><figcaption class="wp-element-caption">You can explore local climate hazards with U.S. White House Climate Mapping tools</figcaption></figure>


<p class="wp-block-paragraph">All of the data are open data with a Developer API, download in common file formats, or explore directly in their Hub.</p>


<figure class="wp-block-image size-large"><a href="https://resilience.climate.gov/"><img data-recalc-dims="1" loading="lazy" decoding="async" width="840" height="482" src="https://i0.wp.com/highearthorbit.com/wp-content/uploads/2023/02/image-1.png?resize=840%2C482&#038;ssl=1" alt="" class="wp-image-309" srcset="https://i0.wp.com/highearthorbit.com/wp-content/uploads/2023/02/image-1.png?resize=1024%2C587&amp;ssl=1 1024w, https://i0.wp.com/highearthorbit.com/wp-content/uploads/2023/02/image-1.png?resize=300%2C172&amp;ssl=1 300w, https://i0.wp.com/highearthorbit.com/wp-content/uploads/2023/02/image-1.png?resize=768%2C440&amp;ssl=1 768w, https://i0.wp.com/highearthorbit.com/wp-content/uploads/2023/02/image-1.png?resize=1536%2C881&amp;ssl=1 1536w, https://i0.wp.com/highearthorbit.com/wp-content/uploads/2023/02/image-1.png?resize=2048%2C1174&amp;ssl=1 2048w, https://i0.wp.com/highearthorbit.com/wp-content/uploads/2023/02/image-1.png?w=1680&amp;ssl=1 1680w, https://i0.wp.com/highearthorbit.com/wp-content/uploads/2023/02/image-1.png?w=2520&amp;ssl=1 2520w" sizes="auto, (max-width: 840px) 100vw, 840px" /></a><figcaption class="wp-element-caption">The U.S. White House Climate Mapping Hub includes open data for download, developers, &amp; analysis</figcaption></figure>


<p class="wp-block-paragraph"><a href="https://mediaspace.esri.com/playlist/dedicated/290804942/1_9q41da9f/1_76mad2ju">watch the White House video here</a>. </p>


<h2 class="wp-block-heading">Disaster Response</h2>


<p class="wp-block-paragraph">The <a href="https://www.gocivilairpatrol.com/">Civil Air Patrol</a> received the &#8220;Making a Difference Award&#8221; for their work coordinating 60,000 volunteers across the country to fly planes, capture imagery and other data, then share it with responders and governments. They publish their information with <a href="https://gis.cap.gov/">CAP Geospatial Hub</a> that supports collaboration across Government agencies, volunteers, and partner organizations.</p>


<figure class="wp-block-image size-large"><img data-recalc-dims="1" loading="lazy" decoding="async" width="840" height="480" src="https://i0.wp.com/highearthorbit.com/wp-content/uploads/2023/02/image-7.png?resize=840%2C480&#038;ssl=1" alt="" class="wp-image-315" srcset="https://i0.wp.com/highearthorbit.com/wp-content/uploads/2023/02/image-7.png?resize=1024%2C585&amp;ssl=1 1024w, https://i0.wp.com/highearthorbit.com/wp-content/uploads/2023/02/image-7.png?resize=300%2C171&amp;ssl=1 300w, https://i0.wp.com/highearthorbit.com/wp-content/uploads/2023/02/image-7.png?resize=768%2C439&amp;ssl=1 768w, https://i0.wp.com/highearthorbit.com/wp-content/uploads/2023/02/image-7.png?resize=1536%2C878&amp;ssl=1 1536w, https://i0.wp.com/highearthorbit.com/wp-content/uploads/2023/02/image-7.png?resize=2048%2C1170&amp;ssl=1 2048w, https://i0.wp.com/highearthorbit.com/wp-content/uploads/2023/02/image-7.png?w=1680&amp;ssl=1 1680w, https://i0.wp.com/highearthorbit.com/wp-content/uploads/2023/02/image-7.png?w=2520&amp;ssl=1 2520w" sizes="auto, (max-width: 840px) 100vw, 840px" /><figcaption class="wp-element-caption">Civil Air Patrols coordinates 60,000 volunteers and uses ArcGIS Hub to manage geospatial collaboration</figcaption></figure>


<p class="wp-block-paragraph">The <a href="https://www.nifc.gov/">National Interagency Fire Center</a> (NIFC), part of the U.S. Department of Agriculture might be the first presenter to carry an axe!</p>


<figure class="wp-block-image size-large"><img data-recalc-dims="1" loading="lazy" decoding="async" width="840" height="604" src="https://i0.wp.com/highearthorbit.com/wp-content/uploads/2023/02/image-2.png?resize=840%2C604&#038;ssl=1" alt="" class="wp-image-310" srcset="https://i0.wp.com/highearthorbit.com/wp-content/uploads/2023/02/image-2.png?resize=1024%2C736&amp;ssl=1 1024w, https://i0.wp.com/highearthorbit.com/wp-content/uploads/2023/02/image-2.png?resize=300%2C216&amp;ssl=1 300w, https://i0.wp.com/highearthorbit.com/wp-content/uploads/2023/02/image-2.png?resize=768%2C552&amp;ssl=1 768w, https://i0.wp.com/highearthorbit.com/wp-content/uploads/2023/02/image-2.png?w=1302&amp;ssl=1 1302w" sizes="auto, (max-width: 840px) 100vw, 840px" /></figure>


<p class="wp-block-paragraph">The Fire team manages a <a href="https://data-nifc.opendata.arcgis.com/">NIFC Hub for sharing Open Data</a> that is used during fire responses, mostly from mobile devices, to coordinate response locations, actions, and shelters. They moved from paper maps to digital maps to have the most recent information which saves lives and improves response.</p>


<figure class="wp-block-image size-large"><img data-recalc-dims="1" loading="lazy" decoding="async" width="840" height="482" src="https://i0.wp.com/highearthorbit.com/wp-content/uploads/2023/02/image-3.png?resize=840%2C482&#038;ssl=1" alt="" class="wp-image-311" srcset="https://i0.wp.com/highearthorbit.com/wp-content/uploads/2023/02/image-3.png?resize=1024%2C587&amp;ssl=1 1024w, https://i0.wp.com/highearthorbit.com/wp-content/uploads/2023/02/image-3.png?resize=300%2C172&amp;ssl=1 300w, https://i0.wp.com/highearthorbit.com/wp-content/uploads/2023/02/image-3.png?resize=768%2C440&amp;ssl=1 768w, https://i0.wp.com/highearthorbit.com/wp-content/uploads/2023/02/image-3.png?resize=1536%2C881&amp;ssl=1 1536w, https://i0.wp.com/highearthorbit.com/wp-content/uploads/2023/02/image-3.png?resize=2048%2C1174&amp;ssl=1 2048w, https://i0.wp.com/highearthorbit.com/wp-content/uploads/2023/02/image-3.png?w=1680&amp;ssl=1 1680w, https://i0.wp.com/highearthorbit.com/wp-content/uploads/2023/02/image-3.png?w=2520&amp;ssl=1 2520w" sizes="auto, (max-width: 840px) 100vw, 840px" /></figure>


<p class="wp-block-paragraph"><a href="https://mediaspace.esri.com/playlist/dedicated/290804942/1_9q41da9f/1_lb441gq9">Watch the National Interagency Fire Center video</a></p>


<h2 class="wp-block-heading">US State Department</h2>


<p class="wp-block-paragraph">The <a href="https://www.state.gov/about-us-bureau-of-conflict-and-stabilization-operations/">U.S. State Department Bureau of Conflict &amp; Stabilization Operations</a> is actively monitoring the invasion of Ukraine. They use several ArcGIS products including ArcGIS Enterprise Sites, the self-hosted version of ArcGIS Hub, to share sensitive information between analysts, governments, and trusted partners to <a href="https://www.state.gov/promoting-accountability-for-war-crimes-and-other-atrocities-in-ukraine/">understand and document atrocities and plan reconstruction</a>.</p>


<figure class="wp-block-image size-large"><img data-recalc-dims="1" loading="lazy" decoding="async" width="840" height="423" src="https://i0.wp.com/highearthorbit.com/wp-content/uploads/2023/02/image-4.png?resize=840%2C423&#038;ssl=1" alt="" class="wp-image-312" srcset="https://i0.wp.com/highearthorbit.com/wp-content/uploads/2023/02/image-4.png?resize=1024%2C516&amp;ssl=1 1024w, https://i0.wp.com/highearthorbit.com/wp-content/uploads/2023/02/image-4.png?resize=300%2C151&amp;ssl=1 300w, https://i0.wp.com/highearthorbit.com/wp-content/uploads/2023/02/image-4.png?resize=768%2C387&amp;ssl=1 768w, https://i0.wp.com/highearthorbit.com/wp-content/uploads/2023/02/image-4.png?resize=1536%2C774&amp;ssl=1 1536w, https://i0.wp.com/highearthorbit.com/wp-content/uploads/2023/02/image-4.png?w=1730&amp;ssl=1 1730w, https://i0.wp.com/highearthorbit.com/wp-content/uploads/2023/02/image-4.png?w=1680&amp;ssl=1 1680w" sizes="auto, (max-width: 840px) 100vw, 840px" /></figure>


<p class="wp-block-paragraph">The <a href="https://conflictobservatory.org/">Conflict Observatory</a> is a publicly accessible part of their Hub for sharing open data and information to raise awareness and influence diplomacy.</p>


<figure class="wp-block-image size-large"><img data-recalc-dims="1" loading="lazy" decoding="async" width="840" height="471" src="https://i0.wp.com/highearthorbit.com/wp-content/uploads/2023/02/image-5.png?resize=840%2C471&#038;ssl=1" alt="" class="wp-image-313" srcset="https://i0.wp.com/highearthorbit.com/wp-content/uploads/2023/02/image-5.png?resize=1024%2C574&amp;ssl=1 1024w, https://i0.wp.com/highearthorbit.com/wp-content/uploads/2023/02/image-5.png?resize=300%2C168&amp;ssl=1 300w, https://i0.wp.com/highearthorbit.com/wp-content/uploads/2023/02/image-5.png?resize=768%2C430&amp;ssl=1 768w, https://i0.wp.com/highearthorbit.com/wp-content/uploads/2023/02/image-5.png?resize=1536%2C860&amp;ssl=1 1536w, https://i0.wp.com/highearthorbit.com/wp-content/uploads/2023/02/image-5.png?w=1728&amp;ssl=1 1728w" sizes="auto, (max-width: 840px) 100vw, 840px" /><figcaption class="wp-element-caption">Conflict Observatory is a public ArcGIS Hub sharing open data for advocacy + accountability</figcaption></figure>


<p class="wp-block-paragraph"><a href="https://mediaspace.esri.com/playlist/dedicated/290804942/1_9q41da9f/1_vfqum625">Watch the U.S. State Department video</a></p>


<h2 class="wp-block-heading">Local + Regional Governments</h2>


<p class="wp-block-paragraph">While the Esri Federal GIS conference highlights Federal Agencies, many local and regional governments participate. The State of Georgia showcased how they used Hub to manage their 2022 Election and reporting, and I heard from many other local governments that are growing their Hubs based on local policies.</p>


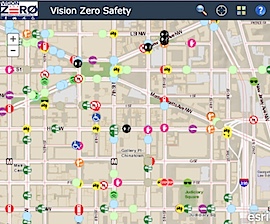
<p class="wp-block-paragraph">During a technical session, the city of Washington, D.C. walked through their process to develop a <a href="https://visionzero.dc.gov/">Vision Zero Initiative Hub.</a> Linda Bailey, Vision Zero Director for DC, and Kevin McMaster of SymGeo provided pragmatic examples for quickly building, iterating, and launching a Hub driven by executive mandate, data-driven policies, and effective community engagement. You can read more about the details on <a href="https://www.symgeo.com/2022/10/27/vision-zero-dc/">their case study</a>.</p>


<figure class="wp-block-image size-large"><a href="https://visionzero.dc.gov/"><img data-recalc-dims="1" loading="lazy" decoding="async" width="840" height="480" src="https://i0.wp.com/highearthorbit.com/wp-content/uploads/2023/02/image-6.png?resize=840%2C480&#038;ssl=1" alt="" class="wp-image-314" srcset="https://i0.wp.com/highearthorbit.com/wp-content/uploads/2023/02/image-6.png?resize=1024%2C585&amp;ssl=1 1024w, https://i0.wp.com/highearthorbit.com/wp-content/uploads/2023/02/image-6.png?resize=300%2C171&amp;ssl=1 300w, https://i0.wp.com/highearthorbit.com/wp-content/uploads/2023/02/image-6.png?resize=768%2C439&amp;ssl=1 768w, https://i0.wp.com/highearthorbit.com/wp-content/uploads/2023/02/image-6.png?resize=1536%2C878&amp;ssl=1 1536w, https://i0.wp.com/highearthorbit.com/wp-content/uploads/2023/02/image-6.png?resize=2048%2C1170&amp;ssl=1 2048w, https://i0.wp.com/highearthorbit.com/wp-content/uploads/2023/02/image-6.png?w=1680&amp;ssl=1 1680w, https://i0.wp.com/highearthorbit.com/wp-content/uploads/2023/02/image-6.png?w=2520&amp;ssl=1 2520w" sizes="auto, (max-width: 840px) 100vw, 840px" /></a><figcaption class="wp-element-caption">Washington, D.C. uses ArcGIS Hub to share data and engage residents to reduce traffic-related injury + death</figcaption></figure>


<p class="wp-block-paragraph">These were just a few highlights from the conference. You can explore more ArcGIS Hubs from around the world in our <a href="https://hub.arcgis.com/pages/gallery">Hub gallery</a>.</p>]]></content><author><name>Andrew Turner</name></author><category term="Geo" /><category term="ArcGIS Hub" /><category term="civic" /><category term="esri" /><category term="open data" /><summary type="html"><![CDATA[Esri recently hosted our annual Federal GIS conference. Experts from across National, Regional, and Local governments attend to learn and share their work using spatial analysis to evaluate and implement effective policies. This was our largest ever conference, a welcome reconnection with people after a few years of the pandemic.]]></summary></entry><entry><title type="html">Civic Council game</title><link href="https://highearthorbit.com/articles/civic-council-game/" rel="alternate" type="text/html" title="Civic Council game" /><published>2023-01-03T03:28:00-05:00</published><updated>2023-01-03T03:28:00-05:00</updated><id>https://highearthorbit.com/articles/civic-council-game</id><content type="html" xml:base="https://highearthorbit.com/articles/civic-council-game/"><![CDATA[<p class="wp-block-paragraph">In October 2022, Nick Sementelli shared a concept that he and Alex Baca had conceived for experimenting with city council committees. This was a follow-on from our <a href="https://highearthorbit.com/articles/understanding-local-elections/" title="">previous project for exploring neighborhood representatives and their stances on various policies</a>. </p>


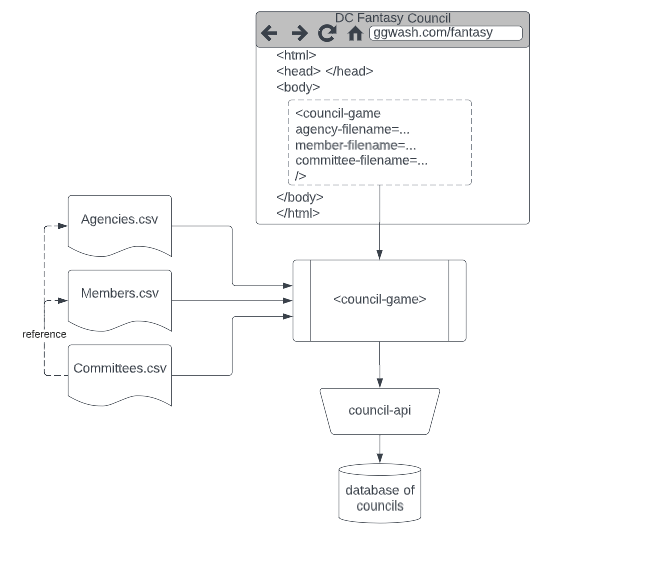
<p class="wp-block-paragraph">We developed a <a href="https://ggwash.org/fantasy" title="">&#8220;Fantasy Council&#8221; game</a>. Anyone can design their own Committees, choosing a Chair, members and government agencies. You can start with the existing council (sans former Council members) or a blank council. The one requirement is the &#8220;Committee of the Whole&#8221; with the Council Chair-person as the Chair of this committee. </p>


<p class="wp-block-paragraph">You can <a href="https://ggwash.org/view/87617/fantasy-dc-council-committee-maker">read more about the concept on GGWash</a>.</p>


<p class="wp-block-paragraph">As an added bonus &#8211; the game is configurable and could easily be re-used by other municipalities or groups to explore organizational assignments.</p>


<figure class="wp-block-image size-large"><img data-recalc-dims="1" loading="lazy" decoding="async" width="840" height="603" src="https://i0.wp.com/highearthorbit.com/wp-content/uploads/2023/01/image.png?resize=840%2C603&#038;ssl=1" alt="" class="wp-image-293" srcset="https://i0.wp.com/highearthorbit.com/wp-content/uploads/2023/01/image.png?resize=1024%2C735&amp;ssl=1 1024w, https://i0.wp.com/highearthorbit.com/wp-content/uploads/2023/01/image.png?resize=300%2C215&amp;ssl=1 300w, https://i0.wp.com/highearthorbit.com/wp-content/uploads/2023/01/image.png?resize=768%2C551&amp;ssl=1 768w, https://i0.wp.com/highearthorbit.com/wp-content/uploads/2023/01/image.png?resize=1536%2C1103&amp;ssl=1 1536w, https://i0.wp.com/highearthorbit.com/wp-content/uploads/2023/01/image.png?w=1708&amp;ssl=1 1708w" sizes="auto, (max-width: 840px) 100vw, 840px" /><figcaption class="wp-element-caption">DC Fantasy Council Game &#8211; design your own committees</figcaption></figure>


<p class="wp-block-paragraph">The UI is strongly inspired by other &#8220;task boards&#8221; like Trello and Github projects. Users can drag + drop agencies or members between committees, rename committees, and name their council. </p>


<p class="wp-block-paragraph">You can save your council for sharing via Email or post to social media site. There is also a simple &#8220;treemap&#8221; budget visualization that clearly shows the relative financial oversight of each committee chair.</p>


<figure class="wp-block-image size-large"><img data-recalc-dims="1" loading="lazy" decoding="async" width="840" height="412" src="https://i0.wp.com/highearthorbit.com/wp-content/uploads/2023/01/image-2.png?resize=840%2C412&#038;ssl=1" alt="" class="wp-image-295" srcset="https://i0.wp.com/highearthorbit.com/wp-content/uploads/2023/01/image-2.png?resize=1024%2C502&amp;ssl=1 1024w, https://i0.wp.com/highearthorbit.com/wp-content/uploads/2023/01/image-2.png?resize=300%2C147&amp;ssl=1 300w, https://i0.wp.com/highearthorbit.com/wp-content/uploads/2023/01/image-2.png?resize=768%2C376&amp;ssl=1 768w, https://i0.wp.com/highearthorbit.com/wp-content/uploads/2023/01/image-2.png?w=1419&amp;ssl=1 1419w" sizes="auto, (max-width: 840px) 100vw, 840px" /><figcaption class="wp-element-caption">Save + Share Your Fantasy Council </figcaption></figure>


<figure class="wp-block-image size-large"><img data-recalc-dims="1" loading="lazy" decoding="async" width="840" height="664" src="https://i0.wp.com/highearthorbit.com/wp-content/uploads/2023/01/image-1.png?resize=840%2C664&#038;ssl=1" alt="" class="wp-image-294" srcset="https://i0.wp.com/highearthorbit.com/wp-content/uploads/2023/01/image-1.png?resize=1024%2C810&amp;ssl=1 1024w, https://i0.wp.com/highearthorbit.com/wp-content/uploads/2023/01/image-1.png?resize=300%2C237&amp;ssl=1 300w, https://i0.wp.com/highearthorbit.com/wp-content/uploads/2023/01/image-1.png?resize=768%2C608&amp;ssl=1 768w, https://i0.wp.com/highearthorbit.com/wp-content/uploads/2023/01/image-1.png?resize=150%2C120&amp;ssl=1 150w, https://i0.wp.com/highearthorbit.com/wp-content/uploads/2023/01/image-1.png?w=1427&amp;ssl=1 1427w" sizes="auto, (max-width: 840px) 100vw, 840px" /><figcaption class="wp-element-caption">Compare relative Committee Budgets and Chair oversight</figcaption></figure>


<p class="wp-block-paragraph">We have a lot more ideas for improvements if we continue with the project. For example,</p>


<ol class="wp-block-list">
<li>Sharing a Council to social media includes a thumbnail summary image</li>


<li>List of shared councils and a leaderboard for voting + commenting</li>


<li>More accessible controls for moving members and agencies</li>
</ol>


<h2 class="wp-block-heading">How it was Built</h2>


<p class="wp-block-paragraph">Like the previous council project, this project is <a href="https://github.com/ajturner/dc-council" title="">open-source code</a> and was built with <a href="https://www.webcomponents.org/introduction" title="">Web Components</a> so that it can be embedded within a content management system like GGWash. The project was designed to be re-usable for other councils by loading all data from Spreadsheets including Members, Agencies, and existing Committee composition. It would be easy to re-use this project for any municipality.</p>


<figure class="wp-block-image size-large"><img data-recalc-dims="1" loading="lazy" decoding="async" width="840" height="475" src="https://i0.wp.com/highearthorbit.com/wp-content/uploads/2023/01/image-3.png?resize=840%2C475&#038;ssl=1" alt="" class="wp-image-296" srcset="https://i0.wp.com/highearthorbit.com/wp-content/uploads/2023/01/image-3.png?resize=1024%2C579&amp;ssl=1 1024w, https://i0.wp.com/highearthorbit.com/wp-content/uploads/2023/01/image-3.png?resize=300%2C170&amp;ssl=1 300w, https://i0.wp.com/highearthorbit.com/wp-content/uploads/2023/01/image-3.png?resize=768%2C434&amp;ssl=1 768w, https://i0.wp.com/highearthorbit.com/wp-content/uploads/2023/01/image-3.png?w=1164&amp;ssl=1 1164w" sizes="auto, (max-width: 840px) 100vw, 840px" /><figcaption class="wp-element-caption">Council Game component composition</figcaption></figure>


<p class="wp-block-paragraph">For saving + sharing committees this project also required a database and API. I tried to store the entire committee state in the URL but the length exceeded social media sharing limits and looked complicated in emails. The database also allows for future leaderboards and discussions.</p>


<figure class="wp-block-image size-full"><img data-recalc-dims="1" loading="lazy" decoding="async" width="667" height="586" src="https://i0.wp.com/highearthorbit.com/wp-content/uploads/2023/01/image-4.png?resize=667%2C586&#038;ssl=1" alt="" class="wp-image-297" srcset="https://i0.wp.com/highearthorbit.com/wp-content/uploads/2023/01/image-4.png?w=667&amp;ssl=1 667w, https://i0.wp.com/highearthorbit.com/wp-content/uploads/2023/01/image-4.png?resize=300%2C264&amp;ssl=1 300w" sizes="auto, (max-width: 667px) 100vw, 667px" /><figcaption class="wp-element-caption">Technical architecture of the Council Game</figcaption></figure>


<p class="wp-block-paragraph">The project was fun to explore modern drag and drop in HTML. It has advanced significantly and mostly works except for complex state logic. I also tried three different IaaS cloud hosting providers to automate the API &#8211; which was surprisingly difficult. Digital Ocean was easy to start, but lacked documentation, Azure is complex, and finally Amazon AWS worked well though has significant security settings that need configuration to connect the Lambda API and the database.</p>]]></content><author><name>Andrew Turner</name></author><category term="Local" /><category term="civic" /><category term="code" /><summary type="html"><![CDATA[In October 2022, Nick Sementelli shared a concept that he and Alex Baca had conceived for experimenting with city council committees. This was a follow-on from our previous project for exploring neighborhood representatives and their stances on various policies.]]></summary></entry><entry><title type="html">Understanding Local Elections</title><link href="https://highearthorbit.com/articles/understanding-local-elections/" rel="alternate" type="text/html" title="Understanding Local Elections" /><published>2022-09-28T17:25:00-04:00</published><updated>2022-09-28T17:25:00-04:00</updated><id>https://highearthorbit.com/articles/understanding-local-elections</id><content type="html" xml:base="https://highearthorbit.com/articles/understanding-local-elections/"><![CDATA[<p class="wp-block-paragraph">Interested in knowing who you can vote for in DC&#8217;s upcoming election? Check out  <a href="https://ggwash.org/view/86803/this-interactive-tool-lets-you-explore-and-candidates-views-on-housing-transportation-and-land-use" target="_blank" rel="noreferrer noopener">Greater Greater Washington</a> to search by your address and learn more about candidates and their positions on important topics.</p>


<h2 class="wp-block-heading">Where are We?</h2>


<p class="wp-block-paragraph">DC is a fundamentally geographical city. The boundaries are (originally) a 10-mile by 10-mile diamond that was located to balance preferences of northern &amp; southern colonies and also be a close distance to George Washington&#8217;s home at Mount Vernon. Our roads are organized in a British-style grid of incrementing letter + number names with crisscrossing French-style roads named for each of the current U.S. States.</p>


<figure class="wp-block-image size-large"><img data-recalc-dims="1" loading="lazy" decoding="async" width="840" height="814" src="https://i0.wp.com/highearthorbit.com/wp-content/uploads/2022/09/Screen-Shot-2022-09-27-at-5.38.49-PM.png?resize=840%2C814&#038;ssl=1" alt="" class="wp-image-251" srcset="https://i0.wp.com/highearthorbit.com/wp-content/uploads/2022/09/Screen-Shot-2022-09-27-at-5.38.49-PM.png?resize=1024%2C992&amp;ssl=1 1024w, https://i0.wp.com/highearthorbit.com/wp-content/uploads/2022/09/Screen-Shot-2022-09-27-at-5.38.49-PM.png?resize=300%2C291&amp;ssl=1 300w, https://i0.wp.com/highearthorbit.com/wp-content/uploads/2022/09/Screen-Shot-2022-09-27-at-5.38.49-PM.png?resize=768%2C744&amp;ssl=1 768w, https://i0.wp.com/highearthorbit.com/wp-content/uploads/2022/09/Screen-Shot-2022-09-27-at-5.38.49-PM.png?w=1267&amp;ssl=1 1267w" sizes="auto, (max-width: 840px) 100vw, 840px" /><figcaption>Washington, DC is governed by 8 wards, 46 Neighborhoods, 345 Single Member Districts </figcaption></figure>


<p class="wp-block-paragraph">Within the City there are 8 Wards, each with approximately 100,000 residents. The Wards are then subdivided into 46 Advisory Neighborhood Commissions (ANC). And finally, each ANC is subdivided into 345 Single Member Districts (SMD) of approximately 2,000 residents. Combined together every resident has a local neighborhood <em>code</em> like 8C02 (Ward 8, ANC 8C, SMD 8C02).</p>


<p class="wp-block-paragraph">One aspect that I find remarkable is that while the 8 Ward Councilmembers (and a few At-Large council members) are paid positions, the other 345 SMD representative commissioners are <em><strong>unpaid volunteers</strong></em>! more on that later&#8230;</p>


<p class="wp-block-paragraph">In 2023, thanks to the U.S. decennial census, the neighborhood boundaries are redrawn to improve equitable representation by balancing population and demographics. Every resident <em>might</em> be assigned a new Ward, ANC, and SMD. (<a href="https://opendata.dc.gov/apps/locate-your-anc-and-smd/explore" target="_blank" rel="noopener">Find yours here!</a>) Within these new boundaries are the people who will represent them on broad city-wide policies to hyperlocal residential building permits, business licenses, and individual road changes. While I&#8217;d love to believe that every city resident has been involved with their local SMD representative and ANC committees, it is more likely that people are unaware of their current, and upcoming, districts and therefore new representatives. </p>


<h2 class="wp-block-heading">Seeing is Understanding</h2>


<p class="wp-block-paragraph">We all know where we live. We should be able to easily find out information about our government and neighborhoods with just this information. I&#8217;m passionate about the potential for everyone to learn and be engaged on topics they care about. This is what I&#8217;ve been working on for the past few decades but I&#8217;m often surprised with how difficult it is to find out &#8220;what&#8217;s going on near me?&#8221;</p>


<p class="wp-block-paragraph">What if you could just type in your address and see what&#8217;s going on and who represents me?</p>


<p class="wp-block-paragraph">While you can use Google Maps to find local stores &#8211; that doesn&#8217;t really tell you what&#8217;s going on. If you&#8217;re lucky there&#8217;s a <a href="https://hub.arcgis.com/pages/gallery" target="_blank" rel="noopener">local Hub</a> that you can find data, similar to <a href="https://opendata.dc.gov/" target="_blank" rel="noopener">Open Data DC</a>.</p>


<h2 class="wp-block-heading">Who are my Candidates?</h2>


<p class="wp-block-paragraph">DC is again a particularly unique part of America. While we are the capital city for the United States, we don&#8217;t have U.S. Senators or Congressional Representatives. Residents of the city have a Mayor, a Ward Councilmember, and then our volunteer ANC representative based on our SMD (Single Member District, like 6C04). Because our ANC representatives are unpaid volunteers they have little budget or ability to campaign other than walking door-to-door to meet over 2,000 constituents.</p>


<p class="wp-block-paragraph">I appreciate and applaud the efforts of my neighbors to take on significant and important work to represent our neighborhood. For the past year I have been a (volunteer) member of my neighborhood <em>Transportation &amp; Public Space Committee </em>(yes, we have TPS reports), so I&#8217;ve become more involved in local issues but I&#8217;m not ready to <em>run for office. </em></p>


<p class="wp-block-paragraph">So, I took the opportunity to collaborate with <a href="https://ggwash.org/" target="_blank" rel="noopener">Greater Greater Washington</a>, a local news organization, to create informative, interactive, and accessible visualizations of their comprehensive candidate surveys. We&#8217;ve created a few versions through the summer, including the <a href="https://ajturner.github.io/dc-elections/2022/primary_mayor.html" target="_blank" rel="noopener">Mayor&#8217;s Primary</a>, <a href="https://ggwash.org/view/85342/a-visualization-of-dc-council-candidates-responses-to-our-endorsement-questionnaire" target="_blank" rel="noopener">Ward Council</a>, and the <a href="https://ggwash.org/view/86450/see-dc-council-at-large-candidates-views-on-housing-transportation-and-land-use" target="_blank" rel="noopener">At-Large Council members</a>. Each of these races are city-wide, so location (within the city) isn&#8217;t very relevant. That&#8217;s very different with the hyper-local SMD candidates.</p>


<p class="wp-block-paragraph">You can now search by address or neighborhood district to find local candidate responses. Since these candidates are <em>volunteers</em> they only have their personal budget and time for any campaigning. Creating an accessible tool like this supports all candidates by making it easy for voters to find out more about the candidates. </p>


<figure class="wp-block-image size-large"><img data-recalc-dims="1" loading="lazy" decoding="async" width="787" height="1024" src="https://i0.wp.com/highearthorbit.com/wp-content/uploads/2022/09/Screen-Shot-2022-09-27-at-8.26.25-PM.png?resize=787%2C1024&#038;ssl=1" alt="DC Election map responses" class="wp-image-256" srcset="https://i0.wp.com/highearthorbit.com/wp-content/uploads/2022/09/Screen-Shot-2022-09-27-at-8.26.25-PM.png?resize=787%2C1024&amp;ssl=1 787w, https://i0.wp.com/highearthorbit.com/wp-content/uploads/2022/09/Screen-Shot-2022-09-27-at-8.26.25-PM.png?resize=231%2C300&amp;ssl=1 231w, https://i0.wp.com/highearthorbit.com/wp-content/uploads/2022/09/Screen-Shot-2022-09-27-at-8.26.25-PM.png?resize=768%2C999&amp;ssl=1 768w, https://i0.wp.com/highearthorbit.com/wp-content/uploads/2022/09/Screen-Shot-2022-09-27-at-8.26.25-PM.png?w=841&amp;ssl=1 841w" sizes="auto, (max-width: 787px) 100vw, 787px" /><figcaption>Find your DC ANC candidates at <a href="https://ggwash.org/view/86803/this-interactive-tool-lets-you-explore-and-candidates-views-on-housing-transportation-and-land-use" target="_blank" rel="noreferrer noopener">Greater Greater Washington</a></figcaption></figure>


<p class="wp-block-paragraph">Unfortunately, not all candidates responded to the survey. That was their decision and it leaves their potential constituents without any information on their positions and priorities. Maybe candidates will still respond and the tool will automatically update with their new responses. </p>


<h2 class="wp-block-heading">How was it built?</h2>


<p class="wp-block-paragraph">This was a fun project to build as it uses several interesting and new technology standards. The visualization is a <em><a href="https://developer.mozilla.org/en-US/docs/Web/Web_Components" target="_blank" rel="noopener">web component</a></em> where software developers can create new HTML elements that work in any webpage or web application framework.</p>


<ul class="wp-block-list"><li><a href="https://stenciljs.com/" target="_blank" rel="noopener">Stencil.js</a> tools from Ionic which simplify the development + builds.</li><li><a href="https://developers.arcgis.com/javascript" target="_blank" rel="noopener">ArcGIS JSAPI</a> for geographic maps</li><li>Data from <a href="https://opendata.dc.gov" target="_blank" rel="noopener">OpenData DC</a> and <a href="https://www.dcboe.org/Elections/2022-Elections" target="_blank" rel="noopener">DC Board of Elections</a></li><li>TypeScript, HTML, + CSS</li></ul>


<p class="wp-block-paragraph">The web component makes it very easy to embed into a website like GGWash &#8211; or any other site built with common website editors (WordPress, Drupal, Wix, etc.). You would just add this code to your website:</p>


<pre class="wp-block-code"><code>&lt;dc-election-survey 
  id="anc" 
  filename="https://ajturner.github.io/dc-elections/assets/2022_anc.csv"
  candidates-files="https://ajturner.github.io/dc-elections/assets/2022_anc_candidates.csv"
  format="surveymonkey"
  show-filter=true
  filter=""
&gt;&lt;/dc-election-survey&gt;

&lt;script type="module" src="https://ajturner.github.io/dc-elections/build/dc-election.esm.js"&gt;&lt;/script&gt;
&lt;script nomodule src="https://ajturner.github.io/dc-elections/build/dc-election.js"&gt;&lt;/script&gt;
&lt;link rel='stylesheet' type='text/css' href='https://cdn.jsdelivr.net/npm/@esri/calcite-components@1.0.0-next.292/dist/calcite/calcite.css' /&gt;
&lt;script type='module' src='https://cdn.jsdelivr.net/npm/@esri/hub-components@4.0.0-beta.341/dist/hub-components/hub-components.esm.js'&gt;&lt;/script&gt;</code></pre>


<p class="wp-block-paragraph">The web component are like building blocks. They can be used independently or put together into a <em>composition</em> that integrates several components together. You can see an overview of the dc-election visualization components and how they load data:</p>


<figure class="wp-block-image size-full"><img data-recalc-dims="1" loading="lazy" decoding="async" width="840" height="529" src="https://i0.wp.com/highearthorbit.com/wp-content/uploads/2022/09/Screen-Shot-2022-09-28-at-10.13.36-AM.png?resize=840%2C529&#038;ssl=1" alt="" class="wp-image-258" srcset="https://i0.wp.com/highearthorbit.com/wp-content/uploads/2022/09/Screen-Shot-2022-09-28-at-10.13.36-AM.png?w=841&amp;ssl=1 841w, https://i0.wp.com/highearthorbit.com/wp-content/uploads/2022/09/Screen-Shot-2022-09-28-at-10.13.36-AM.png?resize=300%2C189&amp;ssl=1 300w, https://i0.wp.com/highearthorbit.com/wp-content/uploads/2022/09/Screen-Shot-2022-09-28-at-10.13.36-AM.png?resize=768%2C484&amp;ssl=1 768w" sizes="auto, (max-width: 840px) 100vw, 840px" /><figcaption>Technical overview of election visualization components</figcaption></figure>


<p class="wp-block-paragraph">The entire code project is open-source at <a href="https://github.com/ajturner/dc-elections" target="_blank" rel="noopener">https://github.com/ajturner/dc-elections</a>. Feel free to check it out and re-use it. There aren&#8217;t currently any tests, and quite a bit of complex logic that emerged as we progressively built the visualizations over time. In future iterations I plan to refactor the project and settle early on a standard format which would simplify a lot of the code.</p>]]></content><author><name>Andrew Turner</name></author><category term="Geo" /><category term="Local" /><category term="Technology" /><category term="civic" /><category term="dc" /><category term="election" /><category term="open data" /><summary type="html"><![CDATA[Interested in knowing who you can vote for in DC&#8217;s upcoming election? Check out Greater Greater Washington to search by your address and learn more about candidates and their positions on important topics.]]></summary></entry><entry><title type="html">10 Year Esri-Versary</title><link href="https://highearthorbit.com/articles/10-year-esri-versary/" rel="alternate" type="text/html" title="10 Year Esri-Versary" /><published>2022-07-11T02:42:00-04:00</published><updated>2022-07-11T02:42:00-04:00</updated><id>https://highearthorbit.com/articles/10-year-esri-versary</id><content type="html" xml:base="https://highearthorbit.com/articles/10-year-esri-versary/"><![CDATA[<p class="wp-block-paragraph">Ten years ago, I joined Esri when GeoIQ was acquired. Geospatial community friends often remark they&#8217;re surprised that I&#8217;m still at Esri. I wanted to share some of the unique aspects of Esri that makes it such an effective place for meaningful work.</p>


<figure class="wp-block-gallery has-nested-images columns-default is-cropped wp-block-gallery-1 is-layout-flex wp-block-gallery-is-layout-flex">
<figure class="wp-block-image size-large"><img data-recalc-dims="1" loading="lazy" decoding="async" width="840" height="630" data-id="230" src="https://i0.wp.com/highearthorbit.com/wp-content/uploads/2022/07/First-day-at-Esri-1.png?resize=840%2C630&#038;ssl=1" alt="" class="wp-image-230" srcset="https://i0.wp.com/highearthorbit.com/wp-content/uploads/2022/07/First-day-at-Esri-1.png?w=1280&amp;ssl=1 1280w, https://i0.wp.com/highearthorbit.com/wp-content/uploads/2022/07/First-day-at-Esri-1.png?resize=300%2C225&amp;ssl=1 300w, https://i0.wp.com/highearthorbit.com/wp-content/uploads/2022/07/First-day-at-Esri-1.png?resize=1024%2C768&amp;ssl=1 1024w, https://i0.wp.com/highearthorbit.com/wp-content/uploads/2022/07/First-day-at-Esri-1.png?resize=768%2C576&amp;ssl=1 768w" sizes="auto, (max-width: 840px) 100vw, 840px" /><figcaption>Entering Esri on Day 1</figcaption></figure>


<figure class="wp-block-image size-large"><img data-recalc-dims="1" loading="lazy" decoding="async" width="840" height="630" data-id="232" src="https://i0.wp.com/highearthorbit.com/wp-content/uploads/2022/07/GeoIQ-Esri.png?resize=840%2C630&#038;ssl=1" alt="" class="wp-image-232" srcset="https://i0.wp.com/highearthorbit.com/wp-content/uploads/2022/07/GeoIQ-Esri.png?w=1280&amp;ssl=1 1280w, https://i0.wp.com/highearthorbit.com/wp-content/uploads/2022/07/GeoIQ-Esri.png?resize=300%2C225&amp;ssl=1 300w, https://i0.wp.com/highearthorbit.com/wp-content/uploads/2022/07/GeoIQ-Esri.png?resize=1024%2C768&amp;ssl=1 1024w, https://i0.wp.com/highearthorbit.com/wp-content/uploads/2022/07/GeoIQ-Esri.png?resize=768%2C576&amp;ssl=1 768w" sizes="auto, (max-width: 840px) 100vw, 840px" /><figcaption>Our old GeoIQ office</figcaption></figure>
</figure>


<p class="wp-block-paragraph">Working at a startup was exciting, but we were more often fighting for new features, market awareness, and big sales rather than customer collaboration and problem-solving. Personally, I want to feel time spent on my job is positively improving society and our world. Working on hard problems requires a long-term view, and the dedication and consistent focus that takes many years and incremental iterations.</p>


<p class="wp-block-paragraph">My time at Esri has been a tremendously gratifying experience where I can directly see <a href="https://dc.esri.com/" target="_blank" rel="noopener">me and my teams&#8217; work</a> have a positive impact on the world through our users. As a team we meet weekly to demo product updates to one another &#8211; but we are most excited when we highlight how people are using these features for their particular work. It&#8217;s fun to ship an update to our search interface, but we love seeing how this helps the Missing Children of Canada or the United Nations Sustainable Development Goals. Now that our software is used by over 10,000 organizations every week we are flabbergasted by the impact of our work.</p>


<p class="wp-block-paragraph">Esri is 50+ year-old company and our platform is already in-place at most every U.S. government organization, from national agency to small town or non-profit, as well as in 190 countries with local staff residents. The Esri staff working with customers often live in the same community, able to incorporate local values, problems, and often knowledge that spans across municipal administrations. When I visit a city office, I&#8217;m often joining a long-term trusted relationship that allows us to focus our discussions on what they can do today and how we can improve the software they will use tomorrow.</p>


<p class="wp-block-paragraph">We know that we don&#8217;t know all the answers up-front. While Esri has a strong opinion that &#8220;geography matters&#8221;, the company is organized for emergent growth and innovation. Teams are set up to address a problem area and then allowed to independently research and deliver new ideas to solve these problems. The only requirements are that the solutions integrate into the core platform and customers validate it supports their needs. Esri hosts an annual user conference that essentially ensures that all products will be delivered and updated on at least a yearly cycle. This is a nice technique to prevent large, waterfall projects that are overly ambitious and never deliver.</p>


<div class="wp-block-jetpack-tiled-gallery aligncenter is-style-rectangular"><div class="tiled-gallery__gallery"><div class="tiled-gallery__row"><div class="tiled-gallery__col" style="flex-basis:100.00000%"><figure class="tiled-gallery__item"><img decoding="async" srcset="https://i1.wp.com/highearthorbit.com/wp-content/uploads/2022/07/ArcGIS-Hub-Team-1-1024x480.png?strip=info&#038;w=600&#038;ssl=1 600w,https://i1.wp.com/highearthorbit.com/wp-content/uploads/2022/07/ArcGIS-Hub-Team-1-1024x480.png?strip=info&#038;w=900&#038;ssl=1 900w,https://i1.wp.com/highearthorbit.com/wp-content/uploads/2022/07/ArcGIS-Hub-Team-1-1024x480.png?strip=info&#038;w=1024&#038;ssl=1 1024w" alt="" data-height="747" data-id="233" data-link="https://highearthorbit.com/?attachment_id=233" data-url="https://highearthorbit.com/wp-content/uploads/2022/07/ArcGIS-Hub-Team-1-1024x480.png" data-width="1595" src="https://i1.wp.com/highearthorbit.com/wp-content/uploads/2022/07/ArcGIS-Hub-Team-1-1024x480.png?ssl=1" data-amp-layout="responsive"/></figure></div></div><div class="tiled-gallery__row"><div class="tiled-gallery__col" style="flex-basis:51.35646%"><figure class="tiled-gallery__item"><img decoding="async" srcset="https://i2.wp.com/highearthorbit.com/wp-content/uploads/2022/07/Esri-Arlington-Open-House-2019-1.jpg?strip=info&#038;w=303&#038;ssl=1 303w" alt="" data-height="162" data-id="234" data-link="https://highearthorbit.com/?attachment_id=234" data-url="https://highearthorbit.com/wp-content/uploads/2022/07/Esri-Arlington-Open-House-2019-1.jpg" data-width="303" src="https://i2.wp.com/highearthorbit.com/wp-content/uploads/2022/07/Esri-Arlington-Open-House-2019-1.jpg?ssl=1" data-amp-layout="responsive"/></figure></div><div class="tiled-gallery__col" style="flex-basis:48.64354%"><figure class="tiled-gallery__item"><img decoding="async" srcset="https://i1.wp.com/highearthorbit.com/wp-content/uploads/2022/07/Esri-Arlington-Open-House-2019-2.jpg?strip=info&#038;w=294&#038;ssl=1 294w" alt="" data-height="166" data-id="235" data-link="https://highearthorbit.com/?attachment_id=235" data-url="https://highearthorbit.com/wp-content/uploads/2022/07/Esri-Arlington-Open-House-2019-2.jpg" data-width="294" src="https://i1.wp.com/highearthorbit.com/wp-content/uploads/2022/07/Esri-Arlington-Open-House-2019-2.jpg?ssl=1" data-amp-layout="responsive"/></figure></div></div></div></div>


<p class="wp-block-paragraph">Esri is a highly collaborative culture. Anyone in the company can conceive and share ideas to any other product. The teams are often small, and so it&#8217;s typically easy to find the person that works on a particular capability to work with them on incorporating this idea. We&#8217;re also collaborative on our we improve our software development practices. In our first week at Esri, we started the new <a href="https://github.com/esri" target="_blank" rel="noopener">GitHub Org for Esri</a> that now includes over 500 open-source repositories in a wide-range of technologies and resources. Eventually we licensed Github Enterprise and now all our projects are available internally for staff to contribute in various ways.</p>


<p class="wp-block-paragraph">We&#8217;re also responsible for the long view of our work. When governments and other organizations depend on your software, you maintain and support what you build for an extended time. When we&#8217;ve argued about adopting a new feature, the conversation is usually hinged around if we believe this particular feature is one we are willing to support for at least 5-10 years.</p>


<p class="wp-block-paragraph">When we released ArcGIS Open Data in 2014, I vividly recall a member of a US National Agency remarking &#8220;This is exactly what I need &#8211; if we adopt this as our solution then don&#8217;t change your minds in a few years. I need you to be with us for the long-haul&#8221;. Now, 8 years later I still periodically see that person and joke with them that we are still <a href="https://www.arcgis.com/apps/MapJournal/index.html?appid=107cac32de164b5fb7da99aceb33939c" target="_blank" rel="noopener">supporting and growing for the future</a>.</p>]]></content><author><name>Andrew Turner</name></author><category term="Personal" /><summary type="html"><![CDATA[Ten years ago, I joined Esri when GeoIQ was acquired. Geospatial community friends often remark they&#8217;re surprised that I&#8217;m still at Esri. I wanted to share some of the unique aspects of Esri that makes it such an effective place for meaningful work.]]></summary></entry><entry><title type="html">Engineering for Birds</title><link href="https://highearthorbit.com/articles/engineering-for-birds/" rel="alternate" type="text/html" title="Engineering for Birds" /><published>2021-05-17T01:47:00-04:00</published><updated>2021-05-17T01:47:00-04:00</updated><id>https://highearthorbit.com/articles/engineering-for-birds</id><content type="html" xml:base="https://highearthorbit.com/articles/engineering-for-birds/"><![CDATA[<p class="wp-block-paragraph">My family has gotten into bird watching. That’s nice and all, but I love the biological mechanics of how nature works. While studying engineering at university <a href="https://www.amazon.com/Cats-Paws-Catapults-Mechanical-Worlds">Cat&#8217;s Paws and Catapults</a> was an inspiration for how engineers can learn from natural mechanics.</p>


<p class="wp-block-paragraph">Our <a href="https://eastcitybookshop.com/">local bookshop, East City Books,</a> has a science section that highlighted &#8220;<a href="https://www.penguinrandomhouse.com/books/215722/what-its-like-to-be-a-bird-by-david-allen-sibley/">What It&#8217;s Like To Be a Bird</a>&#8221; by the reknowned naturalist <a href="https://www.sibleyguides.com/">David Allen Sibley</a>. The book is a fascinating &#8220;How Things Work&#8221; on the biological science of birds. Just a few quick facts to whet your appetite:</p>


<ul class="wp-block-list"><li>Birds have motion sensors in their hips &amp; head that work independently! </li><li>Their toe muscles work like ‘ratchets’ so they can sleep on a branch. </li><li>Feathers include a variety of water repellent techniques.</li></ul>


<figure class="wp-block-gallery aligncenter has-nested-images columns-default is-cropped wp-block-gallery-2 is-layout-flex wp-block-gallery-is-layout-flex">
<figure class="wp-block-image size-large"><img data-recalc-dims="1" loading="lazy" decoding="async" width="768" height="1024" data-id="57" src="https://i0.wp.com/highearthorbit.com/wp-content/uploads/2021/05/Birds1-1.jpeg?resize=768%2C1024&#038;ssl=1" alt="" class="wp-image-57" srcset="https://i0.wp.com/highearthorbit.com/wp-content/uploads/2021/05/Birds1-1.jpeg?resize=768%2C1024&amp;ssl=1 768w, https://i0.wp.com/highearthorbit.com/wp-content/uploads/2021/05/Birds1-1.jpeg?resize=225%2C300&amp;ssl=1 225w, https://i0.wp.com/highearthorbit.com/wp-content/uploads/2021/05/Birds1-1.jpeg?resize=1152%2C1536&amp;ssl=1 1152w, https://i0.wp.com/highearthorbit.com/wp-content/uploads/2021/05/Birds1-1.jpeg?w=1536&amp;ssl=1 1536w" sizes="auto, (max-width: 768px) 100vw, 768px" /></figure>


<figure class="wp-block-image size-large"><img data-recalc-dims="1" loading="lazy" decoding="async" width="768" height="1024" data-id="58" src="https://i0.wp.com/highearthorbit.com/wp-content/uploads/2021/05/Birds3.jpeg?resize=768%2C1024&#038;ssl=1" alt="" class="wp-image-58" srcset="https://i0.wp.com/highearthorbit.com/wp-content/uploads/2021/05/Birds3.jpeg?resize=768%2C1024&amp;ssl=1 768w, https://i0.wp.com/highearthorbit.com/wp-content/uploads/2021/05/Birds3.jpeg?resize=225%2C300&amp;ssl=1 225w, https://i0.wp.com/highearthorbit.com/wp-content/uploads/2021/05/Birds3.jpeg?resize=1152%2C1536&amp;ssl=1 1152w, https://i0.wp.com/highearthorbit.com/wp-content/uploads/2021/05/Birds3.jpeg?w=1536&amp;ssl=1 1536w" sizes="auto, (max-width: 768px) 100vw, 768px" /></figure>


<figure class="wp-block-image size-large"><img data-recalc-dims="1" loading="lazy" decoding="async" width="840" height="1120" data-id="59" src="https://i0.wp.com/highearthorbit.com/wp-content/uploads/2021/05/Birds2-1.jpeg?resize=840%2C1120&#038;ssl=1" alt="" class="wp-image-59" srcset="https://i0.wp.com/highearthorbit.com/wp-content/uploads/2021/05/Birds2-1.jpeg?w=1536&amp;ssl=1 1536w, https://i0.wp.com/highearthorbit.com/wp-content/uploads/2021/05/Birds2-1.jpeg?resize=225%2C300&amp;ssl=1 225w, https://i0.wp.com/highearthorbit.com/wp-content/uploads/2021/05/Birds2-1.jpeg?resize=768%2C1024&amp;ssl=1 768w, https://i0.wp.com/highearthorbit.com/wp-content/uploads/2021/05/Birds2-1.jpeg?resize=1152%2C1536&amp;ssl=1 1152w" sizes="auto, (max-width: 840px) 100vw, 840px" /><figcaption>How Feathers work</figcaption></figure>
</figure>


<p class="wp-block-paragraph"></p>


<p class="wp-block-paragraph"></p>]]></content><author><name>Andrew Turner</name></author><category term="Reading" /><category term="birds" /><category term="book" /><category term="engineering" /><summary type="html"><![CDATA[My family has gotten into bird watching. That’s nice and all, but I love the biological mechanics of how nature works. While studying engineering at university Cat&#8217;s Paws and Catapults was an inspiration for how engineers can learn from natural mechanics.]]></summary></entry><entry><title type="html">Charlottesville Data Bootcamp</title><link href="https://highearthorbit.com/articles/charlottesville-data-bootcamp/" rel="alternate" type="text/html" title="Charlottesville Data Bootcamp" /><published>2017-09-22T00:00:00-04:00</published><updated>2017-09-22T00:00:00-04:00</updated><id>https://highearthorbit.com/articles/charlottesville-data-bootcamp</id><content type="html" xml:base="https://highearthorbit.com/articles/charlottesville-data-bootcamp/"><![CDATA[<p>It was my pleasure to present at the Charlottesville Data Bootcamp this Friday. The town just recently launched their <a href="http://opendata.charlottesville.org/">open data site</a> and were eager to teach the community about what was available and hear feedback and ideas on what could be improved and extended.</p>

<p>The event hosted about 70 people that varied across disciplines and experience. I met librarians, data scientists, attempted politicians, civic advocates, retirees and quite a few government staff. Each conversation was enlightening, giving me insight into expectations, hopes and creative ideas to use the newly available information, tools, and access to start addressing some key issues.</p>

<p>Charlottesville was ahead of the curve by defining <a href="http://widget.charlottesville.org/clearpoint.aspx">key initiatives guides by strategic goals and measures</a>. And <a href="https://www.nateday.me/tow_forecast.html">local residents like Nate Day</a> were already providing documentation for other community analysts.</p>

<p>But launching an open data site, and posting strategy are just the table stakes for effective engagement. Hosting an in person event where people can meet, build relationships and hear honest feedback is imperative to making this work real and effective.</p>

<p>Below are the slides and notes from my talk. My hope was that it recognizes the work that is necessary to start opening information from government agencies, while also aspiring to greater collaboration and coordination that engages every person in a city to become a direct supporter of community initiatives.</p>

<h2 id="talk-cultivating-a-smart-community">Talk: Cultivating a Smart Community</h2>

<p>Charlottesville’s stated goals for their site are to…</p>

<ul>
  <li>promote civic innovation</li>
  <li>underscore data-driven decision making</li>
  <li>demonstrate the power of and advocating for open data</li>
</ul>

<iframe src="//www.slideshare.net/slideshow/embed_code/key/Itu84D8VAArDR1" width="595" height="485" frameborder="0" marginwidth="0" marginheight="0" scrolling="no" style="border:1px solid #CCC; border-width:1px; margin-bottom:5px; max-width: 100%;" allowfullscreen=""> </iframe>
<div style="margin-bottom:5px"> <strong> <a href="//www.slideshare.net/ajturner/charlottesville-data-bootcamp-2017" title="Charlottesville Data bootcamp 2017" target="_blank">Charlottesville Data bootcamp 2017</a> </strong> from <strong><a href="https://www.slideshare.net/ajturner" target="_blank">Andrew Turner</a></strong> </div>

<p>I’ve been visiting Charlottesville since I was a child. My father and his siblings attended the University of Virginia, and I followed along as an Aerospace Engineering student building the UVA Solar Powered, Robotic Airship. While at UVA, I met my wife and we were in the Pep Band (when that was allowed) and later married in Charlottesville. Now we bring our own kids to Charlottesville, and one day hope to retire here. So improving the local community is something that I’m personally invested in.</p>

<p>I spent the beginning of my career designing and building spacecraft control systems. This GOCE satellite orbited so low that the fins used aerodynamic drag to keep the spacecraft aligned. 
The spacecraft measured a highly-precise and accurate gravity fields. But ultimately, only a small number of people had access to the incredible data from this satellite - and that’s unfortunately common across a lot of measurement systems.</p>

<p>I had the fortune to start working with small communities around the world to use this data to address their local needs and opportunities.</p>

<h2 id="data-driven-citizenship">Data Driven Citizenship</h2>

<p>In 2015, <a href="[http://www.pewinternet.org/2015/04/21/open-government-data/]">Pew research study found</a> “65% of Americans in the prior 12 months have used the internet to find data or information pertaining to government.”</p>

<p>Few Americans think governments are very effective in sharing data they collect with the public:</p>
<ul>
  <li>Just 5% say the federal government does this very effectively, with another 39% saying the federal government does this somewhat effectively.</li>
  <li>5% say state governments share data very effectively, with another 44% saying somewhat effectively.</li>
  <li>7% say local governments share data very effectively, with another 45% responding somewhat effectively.</li>
</ul>

<p>People’s baseline level of trust in government strongly shapes how they view the possible impact of open data and open government initiatives on how government functions.</p>

<p>How can we build <a href="https://blogs.esri.com/esri/esri-insider/2016/09/27/data-driven-citizenship/">Data Driven Citizenship?</a></p>

<h2 id="city-ensembles">City Ensembles</h2>

<p>Cities are complex systems of interoperating infrastructure: buildings, roads, water &amp; electrical utilities, information systems. We tend to measure and work with this data to understand and how the city was built.</p>

<p>What is often unmeasured is how the city is used. Every moment of every day the city is alive with people in motion - using assets, moving along streets, pumping water. They are making decisions, actions that influence their commute, their day, their lives. And each day is unique - different from the previous and unexpectedly different tomorrow.</p>

<p>And our cities are not just filled with residents. Cities grow in size through commuters, tourists, and resettlers - potentially doubling the number of people during some hours of the day.</p>

<p>Ultimately, everyone has a place they call home. This street, or building or neighborhood is where they make some of the most important decisions in their life. Their largest financial investment, where they fall in love, walk their dog, raise their children, meet with friends - and grow old and pass on. I believe that no one cares more about a neighborhood street than the people who live there. It is ultimately they who are the lifeblood of our cities.</p>

<p>The real role of government is to create a community that residents, visitors, and business people find to be a great place to live, work, and play.</p>

<p>Hyong Yi
  Assistant City Manager, City of Charlotte</p>

<p>While Every neighborhood is unique, they must act in coordination with one another and the city as a whole. The city is an Ensemble of individual people and streets that cohesively, and coherently comprise the thriving city.</p>

<p>Initiatives are a measurable goal and strategy to improve a particular community need. To be effective, Initiatives require collaboration across government agencies, citizen communities and businesses.</p>

<p>Charlottesville’s Goals:</p>

<p>“We believe providing the data behind our Strategic Plan Goals will allow for better and more informed decision-making, enhance collaboration among City departments, and engage our community in the activities of our organization.”</p>

<h2 id="example-vision-zero-in-dc">Example: Vision Zero in DC</h2>

<p>Vision Zero is a multi-national road traffic safety project which aims to achieve a highway system with no fatalities or serious injuries in road traffic. It started in Sweden and was approved by their parliament in October 1997.</p>

<p>DC Dept of Transportation (DDOT) started with informing the public and sharing data of historic collisions. But this was only the story of where collisions occurred and were reported. What streets were unsafe and had near-hits, or were likely to have a future accident due to poor visibility, too-short crosswalk timings, speeding cars, or lack of protected bike lanes.</p>

<p>DDOT created a public survey where any citizen could report unsafe conditions for pedestrians, bicyclists or motorists. Within the first week they received over 5,000 citizen reports, all of which became an open dataset and also integrated with their 311 service response system.</p>

<p>Now the public could participate in analyzing the historic data, as well as survey data, to answer a few key questions that DDOT needed to know, but didn’t have the internal capacity to answer: where were the most unsafe intersections? Were there trends in accidents by time of day, weather, impact type, or other potential characteristics?</p>

<p>In a few evenings, citizen volunteers whose day jobs were data analytics volunteered to analyze this data to answer these questions and share the results back to the city and advocacy groups. Now the city could prioritize their work orders and infrastructure improvements. Together the city and citizens had a collaborative role to improve the city for everyone.</p>

<h2 id="public-digital-infrastructure">Public Digital Infrastructure</h2>

<p>The government is now supporting a public, digital infrastructure powered by their own enterprise information systems.</p>

<p>StoryMaps are an amazing tool to craft and convey your vision for a better community. Without any coding you can write an immersive story that includes data, maps, videos and other information for compelling narratives to action.</p>

<p>You can quickly design surveys to gather public input, or gather internal metrics on performance and operations.</p>

<p>Spend a few minutes to configure a modern, responsive, and interaction web application with WebApp Builder.</p>

<p>There are over <a href="http://esri.github.io">400 open-source apps, libraries and other developer SDK</a> that work with the Charlottesville open data site. You can do analysis directly in Python and Jupyter notebooks, or in R and other languages. We support open-source tools for <a href="http://esri.github.io/esri-leaflet/">map visualization</a> and <a href="http://esri.github.io/cedar/">charting and other info graphics</a>.</p>

<p><a href="https://github.com/esri/mystreet">MyStreet</a> is an open-source application you can configure to provide residents with a very simple view around their house, business, or other place of interest. When is my trash day and what police district am I located in? You can also update the configuration in realtime if you need to share new information in an emergency or weather event like “is my nearby bus running and are the schools closed?”</p>

<p>We have a new <a href="https://github.com/esri/sonar">open-source research project called “Sonar”</a>. You can now build ‘chat bots’ for Facebook, Slack, SMS Text and Amazon Alexa that integrate with open data. Citizens can now ask questions of your city through familiar, and accessible, social media or ubiquitous devices instead of having to visit your website.</p>

<h2 id="build-for-real-people-with-real-needs">Build for Real People with Real Needs</h2>

<p>You’re probably a bit overwhelmed. And maybe a few of you are thinking “I don’t code/design/write, so probably can’t do something with an impact”.
Let me tell you a story of an 11-year old kid from a recent hackathon I attended. 
He has two particular passions in life. His first is history. He loves it. Can’t learn enough about the who/why/what/when of our past. When he’s riding in the back seat of his dad’s car, he sees these white-colored historic markers fly by. When he asks his dad what it said, his father probably didn’t get a chance to read it as he’s driving down the road.</p>

<p>The boy decided he wanted to build an app to address this problem. So he found the historic markers web database, and configured a web app that worked on his laptop and responsive for a mobile screen. He configured the geolocation, and some other displays so that he could see the marker image and read the historic text. Now, whenever he sees one of these markers on the road, his dad hands the boy his phone and he’s able to “Find nearby” and immediately read the fascinating history of where Thelonius Monk was born.</p>

<p>The boy’s other passion is not dying when he walks to and from school every day. There are often many scary intersections he and his friends have to cross, with sunlight or other factors potentially distracting drivers. 
So he configured a form where his friends and their parents can sign up for a “Walking School Bus”. When they sign up, he setup a walking route optimization analysis to suggest “walking routes” for multiple families, when they should leave and when they are picking up each child at their house. He also created a mobile survey that the parents can use to report dangerous intersections and driving. This data is now being used by the city to evaluate new walking infrastructure and crossing guards for dangerous intersections.</p>

<p>The boy did all of this work in a few hours at the hackathon and presented it to the judges. He won the entire competition.</p>

<p>If an 11-year-old kid can be inspired to solve important problems and accomplish them in a few hours, then so can you.</p>]]></content><author><name>Andrew Turner</name></author><category term="Government" /><category term="Geo" /><category term="Technology" /><category term="Government" /><category term="open data" /><summary type="html"><![CDATA[It was my pleasure to present at the Charlottesville Data Bootcamp this Friday. The town just recently launched their open data site and were eager to teach the community about what was available and hear feedback and ideas on what could be improved and extended.]]></summary></entry><entry><title type="html">The Digital Transformation of Social Impact</title><link href="https://highearthorbit.com/articles/the-digital-transformation-of-social-impact/" rel="alternate" type="text/html" title="The Digital Transformation of Social Impact" /><published>2017-09-18T00:00:00-04:00</published><updated>2017-09-18T00:00:00-04:00</updated><id>https://highearthorbit.com/articles/the-digital-transformation-of-social-impact</id><content type="html" xml:base="https://highearthorbit.com/articles/the-digital-transformation-of-social-impact/"><![CDATA[<h2>The Digital Transformation of Social Impact</h2>

<p>I spoke at a panel at the 71st United Nations General Assembly, as part of the SDG Live event.</p>

<iframe src="https://link.brightcove.com/services/player/bcpid1722935254001/?bctid=5579849847001&amp;autoStart=false&amp;secureConnections=true"></iframe>]]></content><author><name>Andrew Turner</name></author><category term="Government" /><category term="Technology" /><category term="Government" /><category term="sdg" /><category term="united nations" /><summary type="html"><![CDATA[The Digital Transformation of Social Impact]]></summary></entry><entry><title type="html">Data Driven Citizenship</title><link href="https://highearthorbit.com/articles/data-driven-citizenship/" rel="alternate" type="text/html" title="Data Driven Citizenship" /><published>2016-10-08T22:33:22-04:00</published><updated>2016-10-08T22:33:22-04:00</updated><id>https://highearthorbit.com/articles/data-driven-citizenship</id><content type="html" xml:base="https://highearthorbit.com/articles/data-driven-citizenship/"><![CDATA[<p>No one cares about a neighborhood more than the people who live there. People spend their days and evenings along the street, raise children, foster connections with neighbors, build businesses, grow gardens, bike, walk, and live. A few choose to engage with their civil organizations, advocating for positive change, or against negative impacts; they participate in civic meetings, and some even run for office in order to have a professional responsibility to their community. Our fundamental goal of democracy is to expand the engagement and active participation to every person.</p>
<p>Contemporaneously, the internet has provided a platform for immediate and global access to information and people. An increasing majority of people carry a web integrated, sensor laden, geolocated mobile computer that makes this access ubiquitous and pervasive. Whether merely reading or actively publishing information, we have an unprecedented ability to interact with both our physical and digital worlds in coordination - essentially integrating our neighborhoods with realtime and historical data about us and our communities.</p>
<p>One of the primary roles of government historically has been to gather resources in order to build physical infrastructure such as roads, parks, and buildings such that communities and commerce can grow and flourish. Increasingly, a new role is for government to provide a digital public infrastructure, one which supports access to information, in order to improve the efficiency of government operations as well as enable more meaningful decisions by constituents. More than just websites, new digital services are more responsive, scalable, and optimistically more effective in serving people's needs. Combined with open data, information analysis tools, and online forums.</p>
<p>
  <a href="/assets/uploads/2016/10/digital-scout1-lg.jpg"><img src="/assets/uploads/2016/10/digital-scout1-lg.jpg" alt="" width="640" height="480" class="size-large wp-image-8406" /></a>
  <cite>Cub Scout Joshua Perry prepares to collect sales information using Collector for ArcGIS.</cite></p>
<p><a id="more"></a><a id="more-1788"></a></p>
<p>All brought together, we have a tremendous opportunity to dramatically increase the agency of every citizen to have an active and integrated role with the operation of their government. Data-Driven Citizenship means that individual decision making, issue advocacy, and community planning are empowered with the tools and data necessary to make informed actions and observe the outcome of those actions. Instead of merely petitioning for change in a neighborhood, citizens can analyze existing and historical conditions, compare with similar situations and apply data modeling in order to suggest viable alternatives that government can most meaningfully enact. Other communities can connect and observe the factual and cultural outcomes of these projects to inform their own plans.</p>
<p>By example, as part of the The United Nations' International Day of the World's Indigenous People, <a href="http://gisuser.com/2016/08/seven-tribes-create-tribal-story-maps-using-arcgis/">seven tribes developed analyses and shared data narratives that educate on issues at hand, including climate change, forest resiliency and data sovereignty.</a></p>
<p><a href="https://blogs.esri.com/esri/esri-insider/files/2016/09/Tale_of_Southwind_on_a_Changing_Landscape_Tale_of_South_Wind_as_told_by_Clara_Pearson__1933__in_the_Nehalem_Tillamook_Tales__recorded_by_Elizabeth_Derr_Jacobs__edited_by_Melville_Jacobs__1959___and_published_by_Jarold_Ramsey__1990__.png"><img src="https://blogs.esri.com/esri/esri-insider/files/2016/09/Tale_of_Southwind_on_a_Changing_Landscape_Tale_of_South_Wind_as_told_by_Clara_Pearson__1933__in_the_Nehalem_Tillamook_Tales__recorded_by_Elizabeth_Derr_Jacobs__edited_by_Melville_Jacobs__1959___and_published_by_Jarold_Ramsey__1990__-1024x544.png" alt="" width="640" height="340" class="aligncenter size-large wp-image-8405" /></a></p>
<p>The city of Raleigh recently underwent a rezoning plan that could have dramatic impact on homeowners and businesses. Through <a href="http://www.wral.com/raleigh-launches-interactive-map-to-help-residents-with-zoning-changes/13828555/" title="Interactive map helps Raleigh residents with zoning changes">community input on web tools for geographic drawing and comments</a>, the city was able to make both broad city-wide improvements as well as understand the particular characteristics specific to local neighborhoods.</p>
<p>As part of their commitment to reducing pedestrian fatalities through the VisionZero initiative, Washington DC Department of Transportation provided <a href="https//opendata.dc.gov/datasets/3f28bc3ad77f49079efee0ac05d8464c_0" title="DC Vision Zero Safety">open data through both web</a> and mobile survey tools where bicyclists, pedestrians, and motorists could mark areas of the city that were unsafe due to a variety of causes. For instance, many intersections had short cross-walk times, which meant pedestrians may be caught in the middle of the road when cars started crossing; bike lanes had disconnected routes resulting in cyclists merging into the roadway with traffic that had difficult identifying the incoming bicycles.</p>
<p><a href="https://blogs.esri.com/esri/esri-insider/files/2016/09/Vision_Zero_Safety.png"><img src="https://blogs.esri.com/esri/esri-insider/files/2016/09/Vision_Zero_Safety-1024x472.png" alt="DC Vision Zero Safety" width="640" height="295" class="size-large wp-image-8403" /></a>
  <span class="caption">Open Data enables citizens to be active participants with their government community planning.</span>
</p>
<p>Cities and communities around the world are discovering how emerging digital tools such as <a href="http://opendata.arcgis.com/" title="ArcGIS Open Data">open data</a>, <a href="http://solutions.arcgis.com/local-government/help/crowdsource-reporter/" title="Crowdsource Reporter">crowdsourcing</a>, and <a href="http://storymaps.arcgis.com/en/" title="StoryMaps">StoryMaps</a> can make citizens more aware, and also active contributors in how government can improve neighborhoods for everyone. Consider your own initiatives and how data driven citizenship can make an extreme, positive, difference.</p>]]></content><author><name>Andrew Turner</name></author><category term="Government" /><category term="Geo" /><category term="Technology" /><category term="Government" /><category term="open data" /><category term="storymaps" /><category term="vision zero" /><summary type="html"><![CDATA[No one cares about a neighborhood more than the people who live there. People spend their days and evenings along the street, raise children, foster connections with neighbors, build businesses, grow gardens, bike, walk, and live. A few choose to engage with their civil organizations, advocating for positive change, or against negative impacts; they participate in civic meetings, and some even run for office in order to have a professional responsibility to their community. Our fundamental goal of democracy is to expand the engagement and active participation to every person. Contemporaneously, the internet has provided a platform for immediate and global access to information and people. An increasing majority of people carry a web integrated, sensor laden, geolocated mobile computer that makes this access ubiquitous and pervasive. Whether merely reading or actively publishing information, we have an unprecedented ability to interact with both our physical and digital worlds in coordination - essentially integrating our neighborhoods with realtime and historical data about us and our communities. One of the primary roles of government historically has been to gather resources in order to build physical infrastructure such as roads, parks, and buildings such that communities and commerce can grow and flourish. Increasingly, a new role is for government to provide a digital public infrastructure, one which supports access to information, in order to improve the efficiency of government operations as well as enable more meaningful decisions by constituents. More than just websites, new digital services are more responsive, scalable, and optimistically more effective in serving people's needs. Combined with open data, information analysis tools, and online forums. Cub Scout Joshua Perry prepares to collect sales information using Collector for ArcGIS. All brought together, we have a tremendous opportunity to dramatically increase the agency of every citizen to have an active and integrated role with the operation of their government. Data-Driven Citizenship means that individual decision making, issue advocacy, and community planning are empowered with the tools and data necessary to make informed actions and observe the outcome of those actions. Instead of merely petitioning for change in a neighborhood, citizens can analyze existing and historical conditions, compare with similar situations and apply data modeling in order to suggest viable alternatives that government can most meaningfully enact. Other communities can connect and observe the factual and cultural outcomes of these projects to inform their own plans. By example, as part of the The United Nations' International Day of the World's Indigenous People, seven tribes developed analyses and shared data narratives that educate on issues at hand, including climate change, forest resiliency and data sovereignty. The city of Raleigh recently underwent a rezoning plan that could have dramatic impact on homeowners and businesses. Through community input on web tools for geographic drawing and comments, the city was able to make both broad city-wide improvements as well as understand the particular characteristics specific to local neighborhoods. As part of their commitment to reducing pedestrian fatalities through the VisionZero initiative, Washington DC Department of Transportation provided open data through both web and mobile survey tools where bicyclists, pedestrians, and motorists could mark areas of the city that were unsafe due to a variety of causes. For instance, many intersections had short cross-walk times, which meant pedestrians may be caught in the middle of the road when cars started crossing; bike lanes had disconnected routes resulting in cyclists merging into the roadway with traffic that had difficult identifying the incoming bicycles. Open Data enables citizens to be active participants with their government community planning. Cities and communities around the world are discovering how emerging digital tools such as open data, crowdsourcing, and StoryMaps can make citizens more aware, and also active contributors in how government can improve neighborhoods for everyone. Consider your own initiatives and how data driven citizenship can make an extreme, positive, difference.]]></summary></entry><entry><title type="html">National Academies of Sciences, Engineering, and Medicine</title><link href="https://highearthorbit.com/articles/national-academies-of-sciences-engineering-and-medicine/" rel="alternate" type="text/html" title="National Academies of Sciences, Engineering, and Medicine" /><published>2016-07-18T22:15:15-04:00</published><updated>2016-07-18T22:15:15-04:00</updated><id>https://highearthorbit.com/articles/national-academies-of-sciences-engineering-and-medicine</id><content type="html" xml:base="https://highearthorbit.com/articles/national-academies-of-sciences-engineering-and-medicine/"><![CDATA[<p><img src="/assets/uploads/2016/07/national-academies.jpg" width="396" height="82" alt="national academies.jpg" style="float:right; padding-top:5px; padding-bottom:5px; padding-left:5px;" />Signed by President Abraham Lincoln in 1863, the National Academy of Sciences was formed to 'investigate, examine, experiment, and report upon any subject of science' for the nation, congress and federal agencies.</p>
<p>Considering this was the middle of the tumultuous US Civil War government saw the imperative for scientific research and collaboration. The period was also the <a href="https://en.wikipedia.org/wiki/Positivism">scientific age of positivism</a> which focused on empirical evidence, reason and logic. Since its auspicious inception, the National Academy has expanded to include Engineering and Medicine as a comprehensive, trusted organization that provides research leadership and experience to the nation.</p>
<h2 id="geographical_sciences_committee">Geographical Sciences Committee</h2></p>
<p>Last week I was honored and excited to be invited as a member of the the recently reconstituted <a href="http://dels.nas.edu/global/besr/GSC" title="Geographical Sciences Committee">Geographic Sciences Committee</a> (GSC) of the Board of Earth Sciences and Resources. Together with <a href="http://dels.nas.edu/global/besr/GSC-Members" title="GSC Members">my fellow committee members</a> we are devising a research study strategy that focused on major issues and questions faced by Federal agencies and the scientific and engineering communities.</p>
<p>All <a href="http://dels.nas.edu/besr/Reports-Academies-Findings">reports are public</a> and you can see previous focus on <a href="http://dels.nas.edu/global/besr/GSC-Reports" title="GSC Reports">community disaster resilience, land change modeling and transformative research in geographical sciences</a>.</p>
<p>The GSC is also the U.S. liason to the <a href="http://igu-online.org/">International Geographical Union</a> as well as advises the National Academy Foreign Secretary on matters concerning international organizations, programs, and research.</p>
<p>Our tenure is through 2019, so for the next three years we will hear from communities on important research questions, convene experts and meetings to discuss state-of-the-art and opportunities, and produce high-quality reports that give context and direction to future work. My particular interests align with <a href="https://en.wikipedia.org/wiki/Human_geography">human geography</a> and <a href="https://en.wikipedia.org/wiki/Neogeography">neogeography</a> and how we can expand the awareness and utilization of geographical sciences by other domains.</p>
<h2 id="government_university_industry_research_roundtable">Government-University-Industry Research Roundtable</h2></p>
<p>In June I also spoke at the <a href="http://sites.nationalacademies.org/pga/guirr/index.htm" title="Government-University-Industry Research Roundtable Homepage">Government-University-Industry Research Roundtable</a> hosted by <a href="http://sites.nationalacademies.org/PGA/index.htm" title="Policy and Global Affairs">Policy and Global Affairs</a>. The meeting, <a href="http://sites.nationalacademies.org/PGA/guirr/PGA_173049" title="June 2016 Meeting">'Building Smart Communities for the Future'</a>, shared experiences of smart communities around the world.</p>
<p>Our panel spoke about the opportunity for smart communities to support the <a href="https://sustainabledevelopment.un.org/">United Nation Sustainable Development Goals</a> and <em>secondary cities</em>. These cities such as Medellin, Cusco, and Mekelle are rapidly growing and modernizing but outside the typical perspective of large-sale global cities like London and New York City. They serve as visible and innovative incubators of technology, governance and community that better represents the majority of urbanizing populations.</p>
<p>Increasing access to information and communications through smart phones is changing the ability for citizens active role in their government and community development. How these capabilities evolve, empower people but also raise questions or privacy, equality and opportunity are imperative to address.</p>
<p>I'm looking forward to our committee's research work and future open workshops and meetings to hear from everyone on ideas for the future of geographical science.</p>]]></content><author><name>Andrew Turner</name></author><category term="Engineering" /><category term="Technology" /><summary type="html"><![CDATA[Signed by President Abraham Lincoln in 1863, the National Academy of Sciences was formed to 'investigate, examine, experiment, and report upon any subject of science' for the nation, congress and federal agencies. Considering this was the middle of the tumultuous US Civil War government saw the imperative for scientific research and collaboration. The period was also the scientific age of positivism which focused on empirical evidence, reason and logic. Since its auspicious inception, the National Academy has expanded to include Engineering and Medicine as a comprehensive, trusted organization that provides research leadership and experience to the nation. Geographical Sciences Committee Last week I was honored and excited to be invited as a member of the the recently reconstituted Geographic Sciences Committee (GSC) of the Board of Earth Sciences and Resources. Together with my fellow committee members we are devising a research study strategy that focused on major issues and questions faced by Federal agencies and the scientific and engineering communities. All reports are public and you can see previous focus on community disaster resilience, land change modeling and transformative research in geographical sciences. The GSC is also the U.S. liason to the International Geographical Union as well as advises the National Academy Foreign Secretary on matters concerning international organizations, programs, and research. Our tenure is through 2019, so for the next three years we will hear from communities on important research questions, convene experts and meetings to discuss state-of-the-art and opportunities, and produce high-quality reports that give context and direction to future work. My particular interests align with human geography and neogeography and how we can expand the awareness and utilization of geographical sciences by other domains. Government-University-Industry Research Roundtable In June I also spoke at the Government-University-Industry Research Roundtable hosted by Policy and Global Affairs. The meeting, 'Building Smart Communities for the Future', shared experiences of smart communities around the world. Our panel spoke about the opportunity for smart communities to support the United Nation Sustainable Development Goals and secondary cities. These cities such as Medellin, Cusco, and Mekelle are rapidly growing and modernizing but outside the typical perspective of large-sale global cities like London and New York City. They serve as visible and innovative incubators of technology, governance and community that better represents the majority of urbanizing populations. Increasing access to information and communications through smart phones is changing the ability for citizens active role in their government and community development. How these capabilities evolve, empower people but also raise questions or privacy, equality and opportunity are imperative to address. I'm looking forward to our committee's research work and future open workshops and meetings to hear from everyone on ideas for the future of geographical science.]]></summary></entry><entry><title type="html">DHS HIFLD Open: Open Data for Economic Resiliency</title><link href="https://highearthorbit.com/articles/dhs-hifld-open-open-data-for-economic-resiliency/" rel="alternate" type="text/html" title="DHS HIFLD Open: Open Data for Economic Resiliency" /><published>2016-02-02T08:35:36-05:00</published><updated>2016-02-02T08:35:36-05:00</updated><id>https://highearthorbit.com/articles/dhs-hifld-open-open-data-for-economic-resiliency</id><content type="html" xml:base="https://highearthorbit.com/articles/dhs-hifld-open-open-data-for-economic-resiliency/"><![CDATA[<p>Today at the FedGIS conference in Washington, DC, the US Department of Homeland Security announced that Homeland Security Infrastructure Program (HSIP) is now <a title="HIFLD Open" href="https://hifld-dhs-gii.opendata.arcgis.com">HIFLD Open</a>.</p>
<h2 id="security_and_safeguarding">Security and Safeguarding</h2></p>
<p>In 2001, the United States was attacked in a coordinated effort at multiple locations which had devastating impact across the country. We had direct insight into how little we knew about our national infrastructure and assets that are necessary to both protect from attack and leverage in response.</p>
<p>One actionable response was the US Department of Homeland Security (DHS) and National Geospatial Intelligence Agency (NGA) collaborating to develop the Homeland Security Infrastructure Program, HSIP. For the safety of the nation, federal agencies connected and aggregated data from hundreds of regional and local data providers to compile over 500 national geospatial data assets that provide a complete picture to our roads, water systems, schools, communities, facilities and more. The result was the Homeland Infrastructure Foundation-Level Data Working Group, known as HIFLD.</p>
<p>For the past 15 years, HIFLD has successfully managed the data aggregation, curation, and dissemination of these data through computer discs. Access has been restricted to FOUO - For Official Use Only; effectively limiting the access and reuse of these data to pre-approved agency members.</p>
<p><a href="https://hifld-dhs-gii.opendata.arcgis.com"><img src="https://blogs.esri.com/esri/esri-insider/files/2016/02/Home___HIFLD_Open_Data_and_untitled-1024x751.png" alt="HIFLD Open Data" width="640" height="469" class="aligncenter size-large wp-image-6512" /></a></p>
<h2 id="whole_of_nation">Whole of Nation</h2></p>
<p>The DHS mission takes an 'All Threats, All Hazards' approach. But Homeland Security is more than just physical or emergency management. It needs to also address the economic security as well as non-traditional, invisible threats if we are to truly be a resilient nation.</p>
<p>They saw a need to empower every citizen to have an active role in our security. It was necessary to radically shift from yearly, physical media to realtime, on-demand and dynamic data available everywhere, by everyone.</p>
<p>Available today, <a href="https://hifld-dhs-gii.opendata.arcgis.com">HIFLD Open</a> - public access to over 250 datasets as dynamic web services as well as up-to-date downloadable files and visualization tools for users to explore and use these data assets. Data such as <a href="https://hifld-dhs-gii.opendata.arcgis.com/datasets/13c68a8ccb4645b587e1b9d854c7f7cd_0">Alternative Fueling Stations</a> can help local governments evaluate transit infrastructure investments as well as fuel availability during a disaster event; <a href="https://hifld-dhs-gii.opendata.arcgis.com/datasets?q=shipping&amp;sort_by=relevance">shipping infrastructure</a> indicates opportunities for new businesses that need access to goods transportation; and unique data like <a href="https://hifld-dhs-gii.opendata.arcgis.com/datasets/2456da024a1d4cda8b5c09e33236e93d_0">public refridgerated warehouses</a> is important if there is a need to keep vital materials cold.</p><a href="https://blogs.esri.com/esri/esri-insider/files/2016/02/Home___HIFLD_Open_Data.png"><img src="https://blogs.esri.com/esri/esri-insider/files/2016/02/Home___HIFLD_Open_Data.png" alt="HIFLD Open Data categories" width="800" height="548" class="aligncenter size-full wp-image-6513" /></a></p>
<h2 id="government_efficiency">Government efficiency</h2></p>
<p>ArcGIS provides a hosted infrastructure for DHS that provides not only data as web services, but visualization and analytical capabilities to local governments and communities. Using ArcGIS as their Data Platform of choice, DHS was able to curate and publish these data across multiple thematic groups and have an easy user experience that makes these data discoverable and explorable by anyone.</p>
<p>National security requires a Whole of Nation approach, HIFLD Open marks the beginning of a new era that requires participation by everyone. We have an opportunity to be an Open Society, from citizen neighborhood watch, to city law enforcement, state agencies, businesses, and community groups. This large step into the Open by the DHS is also setting a precedent to other governments across the Federal, State, and Local levels to also make more data freely accessible.</p>]]></content><author><name>Andrew Turner</name></author><category term="Government" /><category term="Geo" /><category term="Government" /><category term="DHS" /><category term="HIFLD" /><category term="NGA" /><summary type="html"><![CDATA[Today at the FedGIS conference in Washington, DC, the US Department of Homeland Security announced that Homeland Security Infrastructure Program (HSIP) is now HIFLD Open. Security and Safeguarding In 2001, the United States was attacked in a coordinated effort at multiple locations which had devastating impact across the country. We had direct insight into how little we knew about our national infrastructure and assets that are necessary to both protect from attack and leverage in response. One actionable response was the US Department of Homeland Security (DHS) and National Geospatial Intelligence Agency (NGA) collaborating to develop the Homeland Security Infrastructure Program, HSIP. For the safety of the nation, federal agencies connected and aggregated data from hundreds of regional and local data providers to compile over 500 national geospatial data assets that provide a complete picture to our roads, water systems, schools, communities, facilities and more. The result was the Homeland Infrastructure Foundation-Level Data Working Group, known as HIFLD. For the past 15 years, HIFLD has successfully managed the data aggregation, curation, and dissemination of these data through computer discs. Access has been restricted to FOUO - For Official Use Only; effectively limiting the access and reuse of these data to pre-approved agency members. Whole of Nation The DHS mission takes an 'All Threats, All Hazards' approach. But Homeland Security is more than just physical or emergency management. It needs to also address the economic security as well as non-traditional, invisible threats if we are to truly be a resilient nation. They saw a need to empower every citizen to have an active role in our security. It was necessary to radically shift from yearly, physical media to realtime, on-demand and dynamic data available everywhere, by everyone. Available today, HIFLD Open - public access to over 250 datasets as dynamic web services as well as up-to-date downloadable files and visualization tools for users to explore and use these data assets. Data such as Alternative Fueling Stations can help local governments evaluate transit infrastructure investments as well as fuel availability during a disaster event; shipping infrastructure indicates opportunities for new businesses that need access to goods transportation; and unique data like public refridgerated warehouses is important if there is a need to keep vital materials cold. Government efficiency ArcGIS provides a hosted infrastructure for DHS that provides not only data as web services, but visualization and analytical capabilities to local governments and communities. Using ArcGIS as their Data Platform of choice, DHS was able to curate and publish these data across multiple thematic groups and have an easy user experience that makes these data discoverable and explorable by anyone. National security requires a Whole of Nation approach, HIFLD Open marks the beginning of a new era that requires participation by everyone. We have an opportunity to be an Open Society, from citizen neighborhood watch, to city law enforcement, state agencies, businesses, and community groups. This large step into the Open by the DHS is also setting a precedent to other governments across the Federal, State, and Local levels to also make more data freely accessible.]]></summary></entry><entry><title type="html">Open Data needs Local Analysis</title><link href="https://highearthorbit.com/articles/open-data-needs-local-analysis/" rel="alternate" type="text/html" title="Open Data needs Local Analysis" /><published>2015-10-28T12:08:13-04:00</published><updated>2015-10-28T12:08:13-04:00</updated><id>https://highearthorbit.com/articles/open-data-needs-local-analysis</id><content type="html" xml:base="https://highearthorbit.com/articles/open-data-needs-local-analysis/"><![CDATA[<p><img src="/assets/uploads/2015/10/Vision_Zero__Click_to_Add_Traffic_Safety_Issue-tm.jpg" width="271" height="224" alt="Vision_Zero__Click_to_Add_Traffic_Safety_Issue.png" style="float:right; padding-top:5px; padding-bottom:5px; padding-left:5px;" /></p>
<p>Open Data exists for a purpose. From point of capture, to publication and analysis, data seek to be used to make better decisions. By making the data open, more people can participate in that analysis and decision making process. Particular to government and community, the more people can understand, collaborate and reach consensus, the better the likely outcome.</p>
<p>To support this goal of open data a <a href="https://twitter.com/datalensdc" title="@DataLensDC">few</a> <a href="https://twitter.com/sidewalkballet" title="@SidewalkBallet on Twitter">of us</a> are starting a <a href="http://www.meetup.com/HackShopDC/">new group in DC</a> that will focus on very specific initiatives and issues related to our city and use data and analysis to gain insight and hopefully provide effective solutions. Each month we will choose a particular issue and dive deep into that issue to understand the current state, historical precedence, objectives, policies and start a data-driven dialogue. To guide our explorations, a government representative will introduce the topic, share current work and plans, and be available to answer questions from the group during and after the gathering.</p>
<p>Our first meeting is this <a href="http://www.meetup.com/HackShopDC/events/226003258/">Thursday, October 30</a> and we are focusing on <a href="http://ddot.dc.gov/page/vision-zero-initiative">DC's VisionZero</a> plan to reduce pedestrian and cyclist fatalities to none by 2017. <a href="https://twitter.com/jrogers202">Jonathan Rogers</a> from DC Department of Transportation (DDOT) will be our government and data expert. In preparation for this meeting, DC OCTO has made <a href="http://opendata.dc.gov/datasets">available a number of open datasets</a> such as the <a href="http://opendata.arcgis.com/datasets?q=bike+accidents&amp;sort_by=relevance">last 8 years of bicycle crashes</a>, <a href="http://opendata.dc.gov/datasets/5b0d63150e2c4c47b5b21db73a4fd928_3">bike lanes</a>, <a href="http://opendata.dc.gov/datasets/0a0ff97967fb413b91d5cf444ed82fce_6">bike routes</a>, and <a href="https://github.com/HackShopDC/October29-VisionZeroData/blob/master/opendata.dc.gov/datasets/3f28bc3ad77f49079efee0ac05d8464c_0">crowd-sourced locations of unsafe cycle conditions</a> around the city. You can find the list and contributions in our <a href="https://github.com/HackShopDC/October29-VisionZeroData">github repository</a></p>
<p>If you are interested in data as a hobby or profession, want to apply your analysis skills to <em>data science the heck</em> of this data to help your fellow citizens, please join us! After this initial meeting we plan to migrate through the city, hosting events in each Ward at the local library so that we can make this collaboration inclusive to all citizens and focus on local community issues.</p>
<p>And if you live in another city or town, I encourage you to start something similar focusing on local issues. Ideally, working at the convergence of government, analysts, technologists, and citizens means we can give open data the purpose it wants to achieve.</p>]]></content><author><name>Andrew Turner</name></author><category term="Government" /><category term="Geo" /><category term="Government" /><category term="open data" /><summary type="html"><![CDATA[Open Data exists for a purpose. From point of capture, to publication and analysis, data seek to be used to make better decisions. By making the data open, more people can participate in that analysis and decision making process. Particular to government and community, the more people can understand, collaborate and reach consensus, the better the likely outcome. To support this goal of open data a few of us are starting a new group in DC that will focus on very specific initiatives and issues related to our city and use data and analysis to gain insight and hopefully provide effective solutions. Each month we will choose a particular issue and dive deep into that issue to understand the current state, historical precedence, objectives, policies and start a data-driven dialogue. To guide our explorations, a government representative will introduce the topic, share current work and plans, and be available to answer questions from the group during and after the gathering. Our first meeting is this Thursday, October 30 and we are focusing on DC's VisionZero plan to reduce pedestrian and cyclist fatalities to none by 2017. Jonathan Rogers from DC Department of Transportation (DDOT) will be our government and data expert. In preparation for this meeting, DC OCTO has made available a number of open datasets such as the last 8 years of bicycle crashes, bike lanes, bike routes, and crowd-sourced locations of unsafe cycle conditions around the city. You can find the list and contributions in our github repository If you are interested in data as a hobby or profession, want to apply your analysis skills to data science the heck of this data to help your fellow citizens, please join us! After this initial meeting we plan to migrate through the city, hosting events in each Ward at the local library so that we can make this collaboration inclusive to all citizens and focus on local community issues. And if you live in another city or town, I encourage you to start something similar focusing on local issues. Ideally, working at the convergence of government, analysts, technologists, and citizens means we can give open data the purpose it wants to achieve.]]></summary></entry><entry><title type="html">Apple Watch - Internet of Humans</title><link href="https://highearthorbit.com/articles/apple-watch-internet-of-humans/" rel="alternate" type="text/html" title="Apple Watch - Internet of Humans" /><published>2015-09-24T11:03:49-04:00</published><updated>2015-09-24T11:03:49-04:00</updated><id>https://highearthorbit.com/articles/apple-watch-internet-of-humans</id><content type="html" xml:base="https://highearthorbit.com/articles/apple-watch-internet-of-humans/"><![CDATA[<p>The wristwatch was an invention of convenience for extreme conditions. Previously the pocket watch provided an elegant and portable mechanism for discerning the current time. However increasing <a href="https://en.wikipedia.org/wiki/History_of_watches#Wristwatches">complexity of military maneuvers in the 19th century</a> and more civilly and popularly with the advent of planes, <a href="https://en.wikipedia.org/wiki/Alberto_Santos-Dumont#Wristwatch">pilots wanted precise time measurements</a> without getting in the way. So ingeniously they strapped the watch to their wrist in order to free the hands to fly the plane yet still provide quick access to time.</p>
<p><img src="/assets/uploads/2015/09/Pasted_Image_9_24_15__10_50_AM-199x300.png" alt="Apple Watch Coffee" width="199" height="300" class="alignright size-medium wp-image-1766" style="float: right; padding-left: 5px" />Over more than a hundred years, the wrist watch had become as much a mechanism of fashion as information. It is maintained as the only general cultural acceptable display of machinery on our bodies. From digital devices in candy machines to bejeweled masterpieces, the fundamental concept of a watch is global.</p>
<p>However the utility of personal display of time is stagnant and arguably antiquated. It is difficult to avoid seeing the time displayed with nearly ever glance to a wall, building, or device.  Yet alternative wearable devices have attempted to emerge into consumer mainstream for decades. Often cumbersome, complicated, and limited, no amount of marketing has sustainably become part of our wardrobe.</p>
<h2 id="who_needs_pants">Who needs pants?</h2></p>
<p>A <a href="http://www.tecmark.co.uk/smartphone-usage-data-uk-2014/">survey found in 2014</a> that people perform over 220 tasks per day on their phone and carrying one more often than they are wearing pants. There is also the emerging preference of <a href="http://www.nytimes.com/2014/08/28/business/less-prep-more-plugs-teenagers-favor-tech-over-clothes.html?_r=0">current tech versions over trendy clothes</a>. The handheld window to the web and our digital communities found a visceral niche in our psyche that dramatically altered our behavior.</p>
<p>Like our aviator predecessors, the concept of a hands-free, glance-able information display felt right. While the underlying technology available is tremendously complex, when it comes to our bodies we are reticent to display or deal with complex and awkward devices.</p>
<p>So when it comes to expanding technology out of our pockets and laptops it makes perfect sense to adopt acceptable form factors and instead transparently transform the interactions we have with these objects.</p>
<h2 id="fashionable_cyborgs">Fashionable Cyborgs</h2></p>
<p>While a smart phone is something that carried with us nearly constantly, a smart watch has the unique and paradigm altering position of becoming part of my biology. Smart Watches are a <em>watch</em> only in shape. To consider them as a timepiece is a gross misconception. A smart watch is a network-connected, sensor-laden, interactive computer which is <strong>always visible and constantly in touch with my physical body</strong>.</p>
<p>At any moment it measures my heart rate, temperature, motion, skin galvanic, salinity - as well as the external environment including light luminance, light direction, air temperature, humidity and sound.</p>
<p>These data are then captured, connected, and streamed to mobile and remote processors. This is our first, subtle step to cyborg. So the question becomes, what do we want to do now?</p>
<h2 id="personal_big_data_device">Personal Big Data Device</h2></p>
<p>I rarely want to know <em>What time is it?</em></p>
<p>Rather I want to know <em>How much time until my next event?</em> Time is merely data, what I want is information. The conversion of time data requires balancing my schedule, current location, transit, pending tasks, and a myriad other factors. Computers, and more recently smart phones provide tools for balancing all of this data and providing alerts or suggestions based on our preferences. However these devices can afford to be verbose in their management and interaction. We immerse ourselves into the action of using them in order to extract information.</p>
<p>By contrast, wearable devices like smart watches are antithesis to this immersion. They must instead by passive - raising only relevant information in the appropriate context that balances time, location and urgency. I permit this device to live on my body but the requirement is that it must be a good citizen and behave itself. Failure is banishment.</p>
<p>To succeed, wearable devices must become <strong>Big Data Devices</strong>. They must capture and process huge amounts of data in order to discern the small, highly relevant bits of information that require my human awareness and intervention. They must really be <strong>smart</strong> in truth, not merely in name.</p>
<h2 id="internet_of_humans">Internet of Humans</h2></p>
<p>There are tremendous opportunities for smart devices. Consider that smart watches have a constant monitor on my current health. I don't care about my current heart rate - but I do want to know if over the past four months a heart arrhythmia is detected and I am notified to contact my physician. In fact, all historic heart data can be sent ahead and used as part of the diagnosis.</p>
<p><a href="/assets/uploads/2015/09/Big_Data_graphics_for_Blog.png"><img src="/assets/uploads/2015/09/Big_Data_graphics_for_Blog.png" alt="Heart Rate" width="580" height="332" class="aligncenter size-full wp-image-1767" /></a></p>
<p>What if a smart watch could detect a heart attack and automatically send an alert to emergency response including location and other important health and contact information?</p>
<p>Apple in particular is clearly signaling their intent on this direction. They are providing frameworks such as <a href="https://developer.apple.com/healthkit/">HealthKit</a> and <a href="https://itunes.apple.com/us/app/airstrip-patient-monitoring/id399665195?mt=8">AirStrip</a> as well as more mundanely <a href="https://developer.apple.com/homekit">Home Automation</a>, location, and others in order to encourage innovation of domains while they offer the platform of human bodies pumping out data and attention.</p>
<p>Watch <a href="https://developer.apple.com/videos/wwdc/2015/?id=101">Apple's WWDC 2015 keynote</a> to see how they are building predictive analytics into their software. Your iPhone will be aware that each morning about 8am you go for a run and listen to particular genres of music. So as you head out your door and start your workout an appropriate album starts playing and your fitness tracking app starts logging.</p>
<p>Consider that applied to home automation including thermostat, lights, security system - or purchasing behaviors through Apple Pay that correlate to your activity and health - or even restaurant venue quality measured through ambient consumer devices that are on everyone's wrist throughout the day.</p>
<p><a href="/assets/uploads/2013/09/d119772edbe3756052ca37ad125f03dd.jpg"><img src="/assets/uploads/2013/09/d119772edbe3756052ca37ad125f03dd.jpg" alt="d119772edbe3756052ca37ad125f03dd.jpg" width="150" height="150" style="float: right" class="alignright size-full wp-image-1684" /></a>
<p>Five years ago, Apple acquired a company called <a href="https://en.wikipedia.org/wiki/Color_Labs">Color</a>. There was much derision due to the pre-launch nature and cost of the acquisition. Color's business was using every sensor on a device in order to capture, share and replay the entire environment around a person. Carried to it's end, with sufficient full coverage from every digital device throughout the day across the world - <strong>they were inventing a form of Time Travel</strong>. Not the teleportation kind - but the ability to replay in full clarity, from any vantage point, any previously recorded event and navigate through as an observer. Much like <a href="https://photosynth.net">Microsoft Photosynth</a>.</p>
<p>However a phone is often in your pocket or a bag - muffled by fabric, data suspect due to mixed environments, handling, and visibility. Instead, these devices are emerging into the light and given prominence - and most vitally, <strong>access</strong> - to the world, to the web, and to our physical beings.</p>
<p>The future is not an <em>internet of things</em>, it's an <em>Internet of Humans</em>.</p>]]></content><author><name>Andrew Turner</name></author><category term="Technology" /><category term="Apple" /><category term="apple" /><category term="wearables" /><summary type="html"><![CDATA[The wristwatch was an invention of convenience for extreme conditions. Previously the pocket watch provided an elegant and portable mechanism for discerning the current time. However increasing complexity of military maneuvers in the 19th century and more civilly and popularly with the advent of planes, pilots wanted precise time measurements without getting in the way. So ingeniously they strapped the watch to their wrist in order to free the hands to fly the plane yet still provide quick access to time. Over more than a hundred years, the wrist watch had become as much a mechanism of fashion as information. It is maintained as the only general cultural acceptable display of machinery on our bodies. From digital devices in candy machines to bejeweled masterpieces, the fundamental concept of a watch is global. However the utility of personal display of time is stagnant and arguably antiquated. It is difficult to avoid seeing the time displayed with nearly ever glance to a wall, building, or device. Yet alternative wearable devices have attempted to emerge into consumer mainstream for decades. Often cumbersome, complicated, and limited, no amount of marketing has sustainably become part of our wardrobe. Who needs pants? A survey found in 2014 that people perform over 220 tasks per day on their phone and carrying one more often than they are wearing pants. There is also the emerging preference of current tech versions over trendy clothes. The handheld window to the web and our digital communities found a visceral niche in our psyche that dramatically altered our behavior. Like our aviator predecessors, the concept of a hands-free, glance-able information display felt right. While the underlying technology available is tremendously complex, when it comes to our bodies we are reticent to display or deal with complex and awkward devices. So when it comes to expanding technology out of our pockets and laptops it makes perfect sense to adopt acceptable form factors and instead transparently transform the interactions we have with these objects. Fashionable Cyborgs While a smart phone is something that carried with us nearly constantly, a smart watch has the unique and paradigm altering position of becoming part of my biology. Smart Watches are a watch only in shape. To consider them as a timepiece is a gross misconception. A smart watch is a network-connected, sensor-laden, interactive computer which is always visible and constantly in touch with my physical body. At any moment it measures my heart rate, temperature, motion, skin galvanic, salinity - as well as the external environment including light luminance, light direction, air temperature, humidity and sound. These data are then captured, connected, and streamed to mobile and remote processors. This is our first, subtle step to cyborg. So the question becomes, what do we want to do now? Personal Big Data Device I rarely want to know What time is it? Rather I want to know How much time until my next event? Time is merely data, what I want is information. The conversion of time data requires balancing my schedule, current location, transit, pending tasks, and a myriad other factors. Computers, and more recently smart phones provide tools for balancing all of this data and providing alerts or suggestions based on our preferences. However these devices can afford to be verbose in their management and interaction. We immerse ourselves into the action of using them in order to extract information. By contrast, wearable devices like smart watches are antithesis to this immersion. They must instead by passive - raising only relevant information in the appropriate context that balances time, location and urgency. I permit this device to live on my body but the requirement is that it must be a good citizen and behave itself. Failure is banishment. To succeed, wearable devices must become Big Data Devices. They must capture and process huge amounts of data in order to discern the small, highly relevant bits of information that require my human awareness and intervention. They must really be smart in truth, not merely in name. Internet of Humans There are tremendous opportunities for smart devices. Consider that smart watches have a constant monitor on my current health. I don't care about my current heart rate - but I do want to know if over the past four months a heart arrhythmia is detected and I am notified to contact my physician. In fact, all historic heart data can be sent ahead and used as part of the diagnosis. What if a smart watch could detect a heart attack and automatically send an alert to emergency response including location and other important health and contact information? Apple in particular is clearly signaling their intent on this direction. They are providing frameworks such as HealthKit and AirStrip as well as more mundanely Home Automation, location, and others in order to encourage innovation of domains while they offer the platform of human bodies pumping out data and attention. Watch Apple's WWDC 2015 keynote to see how they are building predictive analytics into their software. Your iPhone will be aware that each morning about 8am you go for a run and listen to particular genres of music. So as you head out your door and start your workout an appropriate album starts playing and your fitness tracking app starts logging. Consider that applied to home automation including thermostat, lights, security system - or purchasing behaviors through Apple Pay that correlate to your activity and health - or even restaurant venue quality measured through ambient consumer devices that are on everyone's wrist throughout the day. Five years ago, Apple acquired a company called Color. There was much derision due to the pre-launch nature and cost of the acquisition. Color's business was using every sensor on a device in order to capture, share and replay the entire environment around a person. Carried to it's end, with sufficient full coverage from every digital device throughout the day across the world - they were inventing a form of Time Travel. Not the teleportation kind - but the ability to replay in full clarity, from any vantage point, any previously recorded event and navigate through as an observer. Much like Microsoft Photosynth. However a phone is often in your pocket or a bag - muffled by fabric, data suspect due to mixed environments, handling, and visibility. Instead, these devices are emerging into the light and given prominence - and most vitally, access - to the world, to the web, and to our physical beings. The future is not an internet of things, it's an Internet of Humans.]]></summary></entry><entry><title type="html">Building Better Civil Solutions with Agile Government</title><link href="https://highearthorbit.com/articles/building-better-civil-solutions-with-agile-government/" rel="alternate" type="text/html" title="Building Better Civil Solutions with Agile Government" /><published>2015-03-09T08:36:17-04:00</published><updated>2015-03-09T08:36:17-04:00</updated><id>https://highearthorbit.com/articles/building-better-civil-solutions-with-agile-government</id><content type="html" xml:base="https://highearthorbit.com/articles/building-better-civil-solutions-with-agile-government/"><![CDATA[<p>Modern technology has dramatically increased the pace of software application development. Within hours a single person can now conceive, create and distribute an app to millions of people. Thanks to the global internet, access and updating of these apps occurs automatically and constantly. Products can be prototyped, measured, improved and updated many times a day. A result of this rapid iteration is the increasing evolution rate and validation of product capabilities that minimizes time to market. <a href="http://blogs.esri.com/esri/esri-insider/files/2015/09/Agile_Process.png"><img class="aligncenter size-full wp-image-5837" src="http://blogs.esri.com/esri/esri-insider/files/2015/09/Agile_Process.png" alt="" width="512" height="319" /></a></p>
<p>Often referred to as 'agile development' or lean, this process is a fundamental shift in how businesses achieve market adoption and customer satisfaction. By contrast, waterfall development historically meant long and disconnected cycles of requirements, design, development, testing and delivery that stretch interminably and often discover late in the process new opportunities or missing requirements. The cost of development and delivery time using waterfall processes can mean projects become 'too big to fail' yet also fail to meet critical business and customer objectives.<a id="more"></a><a id="more-1792"></a></p>
<p>Despite the general acceptance of this new agile methodology by businesses, government has not effectively adopted such strategies. There are many valid reasons why government organizations must be more deliberate in their technology solutions - legal requirements, inclusionary capabilities, and formal policies may all direct software development. However too often these processes lead to numerous examples of <a href="https://en.wikipedia.org/wiki/List_of_failed_and_overbudget_custom_software_projects">'failed IT projects'</a> or <a href="http://www.nextgov.com/cio-briefing/2015/02/high-risk-list-government-it-projects-fail-too-frequently/105063/">high risk programs</a>measuring millions or even billions of dollars in wasted resources.</p>
<p>There is a tremendous opportunity for government to learn and adopt these iterative, evolutionary short-cycles in order to serve constituents more cost-effectively and efficiently.<br /></p>
<h2 id="agile_government">Agile Government</h2><br /><br />
The <a href="https://gds.blog.gov.uk/">United Kingdom</a> and <a href="https://twitter.com/USDS">United States</a>, by example, have created new <em>digital services</em> focused on creating an environment that is accepting and functional using agile development when possible. They are helping evolve government policy, culture, and IT practices to make it appropriate and effective to prototype and develop software solutions in short, iterative cycles. Along with <a href="https://18f.gsa.gov/">18F</a>, they are informing and affecting programs within government as well as vendors that support government.</p>
<p>The <a href="https://playbook.cio.gov/">USDS Playbook</a> is a practical guide to building successful and modern technology projects. This playbook was as a set of requirements in a recent request, <a href="https://18f.gsa.gov/2015/01/08/creating-a-federal-marketplace-for-agile-delivery-services">18F Agile BPA</a>, challenged organizations to concretely demonstrate their ability to apply open and user-centered agile development towards government solutions.</p>
<p>Within three weeks, over 80 companies submitted rapidly developed prototype applications that used a new Open FDA programming interface. <a href="https://18f.gsa.gov/2015/08/28/announcing-the-agile-BPA-awards/">16 companies were recognized</a>for '[delivering] amazing, working software in response to our RFQ.'<br /></p>
<h2 id="gis_for_innovation">GIS for Innovation</h2><br /><br />
We were pleased to participate and be recognized as one of the top submissions to the RFQ. Our <a href="https://github.com/esridc/openfda">Esri OpenFDA Prototype</a> is a prototype, but compelling demonstration of how an integrated platform enables quick and iterative delivery. Our concept was informative and explorable understanding of food and drug recalls that may impact a local community such as a school nutrition specialist, or a healthcare official tracking larger scale health issues.</p>
<p><a href="http://blogs.esri.com/esri/esri-insider/files/2015/09/GSA_18F_Prototype.png"><img class="aligncenter size-large wp-image-5838" src="http://blogs.esri.com/esri/esri-insider/files/2015/09/GSA_18F_Prototype-1024x564.png" alt="" width="640" height="352" /></a> Working entirely through Github as our collaboration hub, we designated <a href="https://github.com/esridc/openfda/wiki#personas">primary user personas</a> based on our experience in the health industry and connected with real people that could provide meaningful feedback. Then our designer created <a href="https://github.com/esridc/openfda/wiki#wireframes">low-fidelity user interface wireframes</a> that we tested in quick 10-minute interviews with our persona users. During daily standup meeting we reviewed the previous day progress, feedback from in-situ user testing, and new or modified development priorities for the day.</p>
<p>Throughout the project, it was apparent the value of an integrated GIS platform. With off-the-shelf applications and ArcGIS Online, we started visualizing the data and exploring application interfaces in mere hours. We also built a <a href="https://github.com/esridc/openfda/blob/master/koop-docker/README.md">data adapter to the Open FDA interface</a> that converted into the GeoServices API. Our data team could iterate through these tools while the developers began a custom interface with our <a href="https://developers.arcgis.com/javascript/">Javascript API</a> and <a href="https://github.com/esri/cedar">open-source visualization</a>libraries.</p>
<p>Using geography, we were also able to use the US Census demographics data to provide context. In this example, we analyzed the food and drug recalls by state, including the the overall affected population.<br /></p>
<h2 id="prototypes_to_production">Prototypes to Production</h2><br /><br />
Throughout the three week exercise, by performing daily check-ins we were able to measure our progress against the regular cadence. New information meant we could improve our overall project without threatening long delays or building unnecessary code.</p>
<p>This experience demonstrates a very fast process to validate and demonstrate concepts. While this project stopped, it is indicative of the process we employ across the entire ArcGIS product platform. Many teams work in weekly sprint cycles and monthly or quarterly software releases that culiminate in <a href="http://www.esri.com/events/user-conference">our yearly big releases</a>. It's a model for organizations of all sizes, from small startup, to multinational enterprise and government, to effectively respond to changing requirements and user needs.</p>
<p>If you want to know more about how ArcGIS can be used to support open and collaborative government projects, connect directly with <a title="Email Lauren Lipovic" href="mailto:LLipovic@esri.com">Lauren Lipovic</a> at at 703-506-9515 or talk with your local ArcGIS representative.</p>]]></content><author><name>Andrew Turner</name></author><category term="Government" /><category term="Technology" /><category term="Government" /><summary type="html"><![CDATA[Modern technology has dramatically increased the pace of software application development. Within hours a single person can now conceive, create and distribute an app to millions of people. Thanks to the global internet, access and updating of these apps occurs automatically and constantly. Products can be prototyped, measured, improved and updated many times a day. A result of this rapid iteration is the increasing evolution rate and validation of product capabilities that minimizes time to market. Often referred to as 'agile development' or lean, this process is a fundamental shift in how businesses achieve market adoption and customer satisfaction. By contrast, waterfall development historically meant long and disconnected cycles of requirements, design, development, testing and delivery that stretch interminably and often discover late in the process new opportunities or missing requirements. The cost of development and delivery time using waterfall processes can mean projects become 'too big to fail' yet also fail to meet critical business and customer objectives. Despite the general acceptance of this new agile methodology by businesses, government has not effectively adopted such strategies. There are many valid reasons why government organizations must be more deliberate in their technology solutions - legal requirements, inclusionary capabilities, and formal policies may all direct software development. However too often these processes lead to numerous examples of 'failed IT projects' or high risk programsmeasuring millions or even billions of dollars in wasted resources. There is a tremendous opportunity for government to learn and adopt these iterative, evolutionary short-cycles in order to serve constituents more cost-effectively and efficiently. Agile Government The United Kingdom and United States, by example, have created new digital services focused on creating an environment that is accepting and functional using agile development when possible. They are helping evolve government policy, culture, and IT practices to make it appropriate and effective to prototype and develop software solutions in short, iterative cycles. Along with 18F, they are informing and affecting programs within government as well as vendors that support government. The USDS Playbook is a practical guide to building successful and modern technology projects. This playbook was as a set of requirements in a recent request, 18F Agile BPA, challenged organizations to concretely demonstrate their ability to apply open and user-centered agile development towards government solutions. Within three weeks, over 80 companies submitted rapidly developed prototype applications that used a new Open FDA programming interface. 16 companies were recognizedfor '[delivering] amazing, working software in response to our RFQ.' GIS for Innovation We were pleased to participate and be recognized as one of the top submissions to the RFQ. Our Esri OpenFDA Prototype is a prototype, but compelling demonstration of how an integrated platform enables quick and iterative delivery. Our concept was informative and explorable understanding of food and drug recalls that may impact a local community such as a school nutrition specialist, or a healthcare official tracking larger scale health issues. Working entirely through Github as our collaboration hub, we designated primary user personas based on our experience in the health industry and connected with real people that could provide meaningful feedback. Then our designer created low-fidelity user interface wireframes that we tested in quick 10-minute interviews with our persona users. During daily standup meeting we reviewed the previous day progress, feedback from in-situ user testing, and new or modified development priorities for the day. Throughout the project, it was apparent the value of an integrated GIS platform. With off-the-shelf applications and ArcGIS Online, we started visualizing the data and exploring application interfaces in mere hours. We also built a data adapter to the Open FDA interface that converted into the GeoServices API. Our data team could iterate through these tools while the developers began a custom interface with our Javascript API and open-source visualizationlibraries. Using geography, we were also able to use the US Census demographics data to provide context. In this example, we analyzed the food and drug recalls by state, including the the overall affected population. Prototypes to Production Throughout the three week exercise, by performing daily check-ins we were able to measure our progress against the regular cadence. New information meant we could improve our overall project without threatening long delays or building unnecessary code. This experience demonstrates a very fast process to validate and demonstrate concepts. While this project stopped, it is indicative of the process we employ across the entire ArcGIS product platform. Many teams work in weekly sprint cycles and monthly or quarterly software releases that culiminate in our yearly big releases. It's a model for organizations of all sizes, from small startup, to multinational enterprise and government, to effectively respond to changing requirements and user needs. If you want to know more about how ArcGIS can be used to support open and collaborative government projects, connect directly with Lauren Lipovic at at 703-506-9515 or talk with your local ArcGIS representative.]]></summary></entry><entry><title type="html">Making GIS a Part of the Open Web</title><link href="https://highearthorbit.com/articles/making-gis-a-part-of-the-open-web/" rel="alternate" type="text/html" title="Making GIS a Part of the Open Web" /><published>2014-11-19T22:36:53-05:00</published><updated>2014-11-19T22:36:53-05:00</updated><id>https://highearthorbit.com/articles/making-gis-a-part-of-the-open-web</id><content type="html" xml:base="https://highearthorbit.com/articles/making-gis-a-part-of-the-open-web/"><![CDATA[<p><em><strong>GeoServices provide a common API across all of GIS for users and developers to easily access information.</strong></em></p>
<p>Today is GIS Day, an annual celebration and sharing to our communities about the use of geospatial technology to understand, affect, and engage with our physical world. You can join any of hundreds of local events around the globe to meet local experts, developers, analysts, government staff, and engaged citizens to learn about how to access open data and spatial analysis tools that help you make sense of complex relationships.</p>
<p><strong>Common Services</strong></p>
<p>At the interface of GIS is a commonly overlooked, but incredibly powerful mechanism that makes it possible to uniformly access data regardless of the underlying technology or source of the data. It is this interface which allows for a smartphone application to work with web sites and desktop analysis tools'&rdquo;meaning that people can use the user experience that most fits their needs but they are working from the same common information system.</p>
<p><a id="more"></a><a id="more-1794"></a>The web is designed on this same principle that loosely coupled systems are more scalable, flexible, and usable through community and industry standards. The HyperText Transfer Protocol, or HTTP, is the protocol that nearly everyone has become familiar with as we enter website URLs into our browsers. There are <a href="http://en.wikipedia.org/wiki/Application_layer" target="_blank">many comparable services</a> such as SMTP for Email, FTP for file sharing, SSH for remote computer access and so on. These are application layers that work on top of the rest of the <a href="http://en.wikipedia.org/wiki/Internet_protocol_suite" target="_blank">Internet protocol suite</a> and enable Twitter to talk to Gmail to Amazon to Skype and so on.</p>
<p><strong>GeoServices</strong></p>
<p>In GIS, there are similar <a href="http://en.wikipedia.org/wiki/GIS_file_formats">application protocols</a> - the most common of which are the <a href="http://www.esri.com/industries/landing-pages/geoservices/geoservices">GeoServices standard</a> which is the common API (Application Programming Interface) across all of ArcGIS. This specification is the nervous system of GIS makes all of the technology work together.</p>
<p>[caption id="attachment_3899" align="aligncenter" width="635"]<img class="size-full wp-image-3899" src="http://blogs.esri.com/esri/esri-insider/files/2014/11/GeoServices-Architecture.png" alt="" width="635" height="325" /> GeoServices Architecture.[/caption]</p>
<p>From interoperability to mashups, an API is the gateway to dynamically requests information. Through one common interface, any developer can access data independent of the underlying database, technology or information domain. This means that users can access parcel data, next to <a href="https://developers.arcgis.com/en/features/geo-enrichment/">business and demographics</a>, with air quality, all through the same interface. We are seeing <a href="http://www.esri.com/software/arcgis/arcgisonline/arcgis-open-data">thousands of organizations making their data openly available</a> from the source through the GeoServices API.</p>
<p>The <a href="http://resources.arcgis.com/en/help/arcgis-rest-api/#/The_ArcGIS_REST_API/02r300000054000000/">GeoServices documentation</a> covers the broad and deep functionality, from <a href="https://developers.arcgis.com/en/features/cloud-storage/">simple data storage, filtering</a>, to more complex statistical analysis, <a href="http://resources.arcgis.com/en/help/arcgis-rest-api/#/Geometry_Service/02r3000000qs000000/">spatial processing</a>, <a href="https://developers.arcgis.com/en/features/geocoding/">geocoding</a>, and<a href="https://developers.arcgis.com/en/features/mapping/">visualization</a>. Through an simple HTTP-based interface, application developers can create their own unique applications powered by data coming from GIS hosted by authoritative government agencies or enterprise business data centers.</p>
<p>There are also <a href="https://developers.arcgis.com/documentation/">numerous supported software toolkits</a> and open-source libraries that make it easy to work with this API, including <a href="https://github.com/esri/geoservices-js">Javascript</a>, <a href="https://github.com/jasonbot/arcrest">Python</a>, <a href="https://github.com/esri/geoservices-ruby">Ruby</a>.</p>
<p><strong>Services that Grow</strong></p>
<p>ArcGIS supports many open standards that make it easy for GIS to work in whatever application the user needs to work. What's most exciting about the GeoServices interface is the comprehensiveness of capabilities, formats, and broad support. It is also a continually evolving specification that grows to support new features of the web such as <a href="https://developers.arcgis.com/javascript/jssamples/layers_streamlayer.html">realtime</a> <a href="http://blogs.esri.com/esri/arcgis/2014/02/12/35327/">stream services</a>.</p>
<p>So on GIS Day, learn how to use the world of data that is already out there, ready for you to explore and re-use in creative and meaningful ways.</p>]]></content><author><name>Andrew Turner</name></author><category term="Web" /><category term="Standards" /><category term="Geo" /><category term="Technology" /><category term="Web" /><category term="API" /><category term="ArcGIS" /><category term="GIS" /><summary type="html"><![CDATA[GeoServices provide a common API across all of GIS for users and developers to easily access information. Today is GIS Day, an annual celebration and sharing to our communities about the use of geospatial technology to understand, affect, and engage with our physical world. You can join any of hundreds of local events around the globe to meet local experts, developers, analysts, government staff, and engaged citizens to learn about how to access open data and spatial analysis tools that help you make sense of complex relationships. Common Services At the interface of GIS is a commonly overlooked, but incredibly powerful mechanism that makes it possible to uniformly access data regardless of the underlying technology or source of the data. It is this interface which allows for a smartphone application to work with web sites and desktop analysis tools'&rdquo;meaning that people can use the user experience that most fits their needs but they are working from the same common information system. The web is designed on this same principle that loosely coupled systems are more scalable, flexible, and usable through community and industry standards. The HyperText Transfer Protocol, or HTTP, is the protocol that nearly everyone has become familiar with as we enter website URLs into our browsers. There are many comparable services such as SMTP for Email, FTP for file sharing, SSH for remote computer access and so on. These are application layers that work on top of the rest of the Internet protocol suite and enable Twitter to talk to Gmail to Amazon to Skype and so on. GeoServices In GIS, there are similar application protocols - the most common of which are the GeoServices standard which is the common API (Application Programming Interface) across all of ArcGIS. This specification is the nervous system of GIS makes all of the technology work together. [caption id="attachment_3899" align="aligncenter" width="635"] GeoServices Architecture.[/caption] From interoperability to mashups, an API is the gateway to dynamically requests information. Through one common interface, any developer can access data independent of the underlying database, technology or information domain. This means that users can access parcel data, next to business and demographics, with air quality, all through the same interface. We are seeing thousands of organizations making their data openly available from the source through the GeoServices API. The GeoServices documentation covers the broad and deep functionality, from simple data storage, filtering, to more complex statistical analysis, spatial processing, geocoding, andvisualization. Through an simple HTTP-based interface, application developers can create their own unique applications powered by data coming from GIS hosted by authoritative government agencies or enterprise business data centers. There are also numerous supported software toolkits and open-source libraries that make it easy to work with this API, including Javascript, Python, Ruby. Services that Grow ArcGIS supports many open standards that make it easy for GIS to work in whatever application the user needs to work. What's most exciting about the GeoServices interface is the comprehensiveness of capabilities, formats, and broad support. It is also a continually evolving specification that grows to support new features of the web such as realtime stream services. So on GIS Day, learn how to use the world of data that is already out there, ready for you to explore and re-use in creative and meaningful ways.]]></summary></entry></feed>